Jordanian vs Scandinavian Poverty
COMPARE
Jordanian
Scandinavian
Poverty
Poverty Comparison
Jordanians
Scandinavians
11.4%
POVERTY
96.0/ 100
METRIC RATING
86th/ 347
METRIC RANK
11.1%
POVERTY
98.2/ 100
METRIC RATING
57th/ 347
METRIC RANK
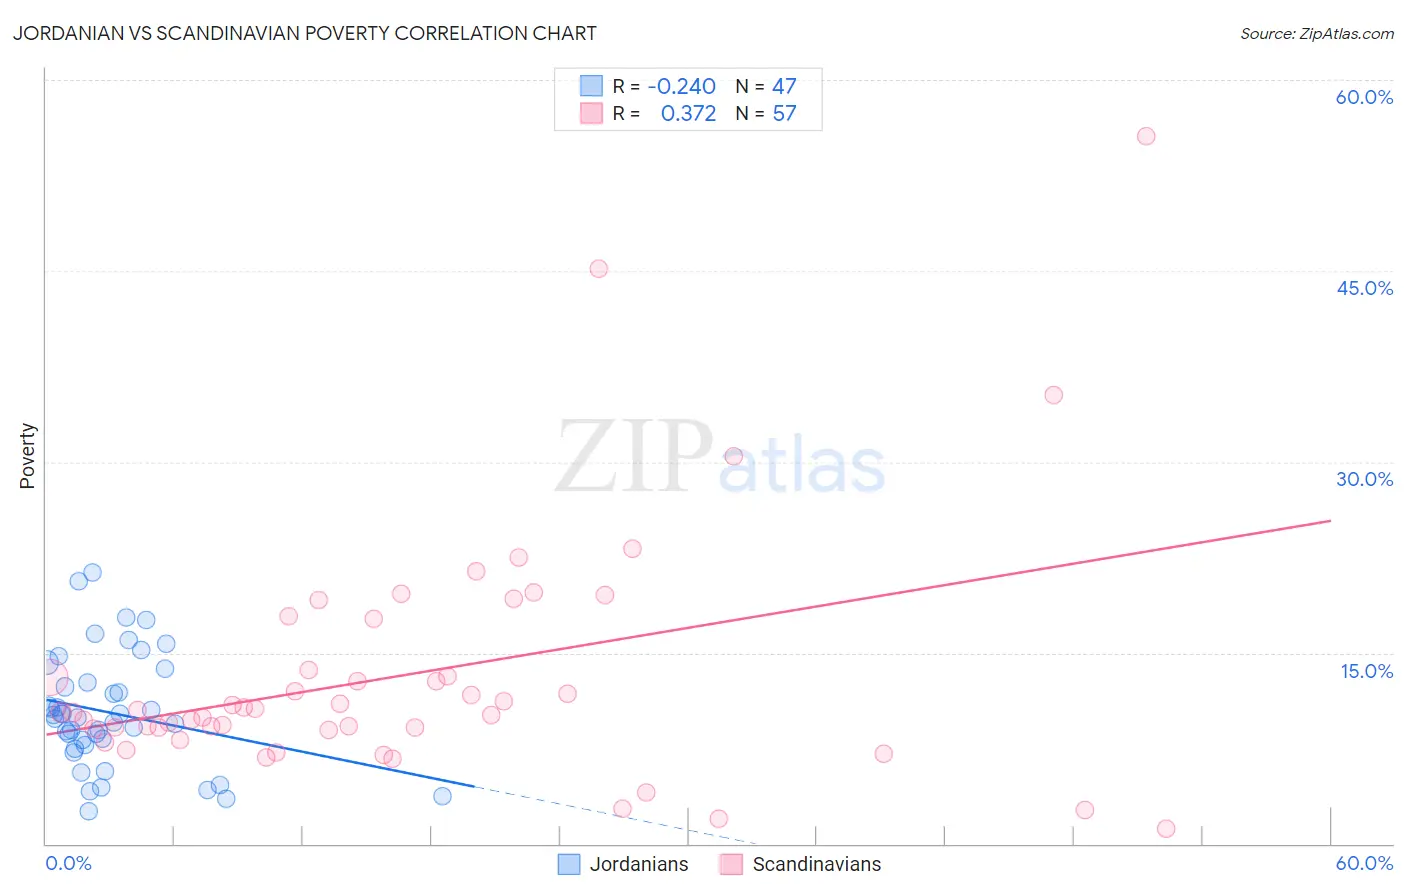
Jordanian vs Scandinavian Poverty Correlation Chart
The statistical analysis conducted on geographies consisting of 166,402,418 people shows a weak negative correlation between the proportion of Jordanians and poverty level in the United States with a correlation coefficient (R) of -0.240 and weighted average of 11.4%. Similarly, the statistical analysis conducted on geographies consisting of 472,236,083 people shows a mild positive correlation between the proportion of Scandinavians and poverty level in the United States with a correlation coefficient (R) of 0.372 and weighted average of 11.1%, a difference of 2.2%.
Poverty Correlation Summary
| Measurement | Jordanian | Scandinavian |
| Minimum | 2.5% | 1.1% |
| Maximum | 21.3% | 55.6% |
| Range | 18.7% | 54.4% |
| Mean | 10.3% | 13.2% |
| Median | 9.9% | 10.3% |
| Interquartile 25% (IQ1) | 7.7% | 9.0% |
| Interquartile 75% (IQ3) | 12.7% | 15.7% |
| Interquartile Range (IQR) | 5.0% | 6.7% |
| Standard Deviation (Sample) | 4.4% | 9.6% |
| Standard Deviation (Population) | 4.4% | 9.6% |
Similar Demographics by Poverty
Demographics Similar to Jordanians by Poverty
In terms of poverty, the demographic groups most similar to Jordanians are Northern European (11.4%, a difference of 0.0%), Immigrants from England (11.4%, a difference of 0.12%), Belgian (11.4%, a difference of 0.14%), English (11.3%, a difference of 0.18%), and Czechoslovakian (11.4%, a difference of 0.18%).
| Demographics | Rating | Rank | Poverty |
| Cambodians | 96.7 /100 | #79 | Exceptional 11.3% |
| Indians (Asian) | 96.6 /100 | #80 | Exceptional 11.3% |
| Irish | 96.6 /100 | #81 | Exceptional 11.3% |
| Egyptians | 96.5 /100 | #82 | Exceptional 11.3% |
| Immigrants | Sweden | 96.3 /100 | #83 | Exceptional 11.3% |
| English | 96.3 /100 | #84 | Exceptional 11.3% |
| Immigrants | England | 96.2 /100 | #85 | Exceptional 11.4% |
| Jordanians | 96.0 /100 | #86 | Exceptional 11.4% |
| Northern Europeans | 96.0 /100 | #87 | Exceptional 11.4% |
| Belgians | 95.8 /100 | #88 | Exceptional 11.4% |
| Czechoslovakians | 95.7 /100 | #89 | Exceptional 11.4% |
| Immigrants | Denmark | 95.5 /100 | #90 | Exceptional 11.4% |
| Finns | 95.2 /100 | #91 | Exceptional 11.4% |
| British | 95.0 /100 | #92 | Exceptional 11.4% |
| Romanians | 94.9 /100 | #93 | Exceptional 11.4% |
Demographics Similar to Scandinavians by Poverty
In terms of poverty, the demographic groups most similar to Scandinavians are Estonian (11.1%, a difference of 0.040%), German (11.1%, a difference of 0.060%), Immigrants from Europe (11.2%, a difference of 0.21%), Immigrants from Sri Lanka (11.2%, a difference of 0.37%), and Immigrants from Italy (11.2%, a difference of 0.44%).
| Demographics | Rating | Rank | Poverty |
| Asians | 98.9 /100 | #50 | Exceptional 11.0% |
| Immigrants | Croatia | 98.7 /100 | #51 | Exceptional 11.0% |
| Immigrants | Philippines | 98.7 /100 | #52 | Exceptional 11.0% |
| Immigrants | Austria | 98.6 /100 | #53 | Exceptional 11.1% |
| Immigrants | Bulgaria | 98.5 /100 | #54 | Exceptional 11.1% |
| Immigrants | Serbia | 98.5 /100 | #55 | Exceptional 11.1% |
| Estonians | 98.2 /100 | #56 | Exceptional 11.1% |
| Scandinavians | 98.2 /100 | #57 | Exceptional 11.1% |
| Germans | 98.1 /100 | #58 | Exceptional 11.1% |
| Immigrants | Europe | 98.0 /100 | #59 | Exceptional 11.2% |
| Immigrants | Sri Lanka | 97.9 /100 | #60 | Exceptional 11.2% |
| Immigrants | Italy | 97.9 /100 | #61 | Exceptional 11.2% |
| Austrians | 97.8 /100 | #62 | Exceptional 11.2% |
| Ukrainians | 97.8 /100 | #63 | Exceptional 11.2% |
| Swiss | 97.7 /100 | #64 | Exceptional 11.2% |