Aleut vs Scandinavian Median Female Earnings
COMPARE
Aleut
Scandinavian
Median Female Earnings
Median Female Earnings Comparison
Aleuts
Scandinavians
$38,719
MEDIAN FEMALE EARNINGS
11.6/ 100
METRIC RATING
211th/ 347
METRIC RANK
$38,306
MEDIAN FEMALE EARNINGS
5.2/ 100
METRIC RATING
232nd/ 347
METRIC RANK
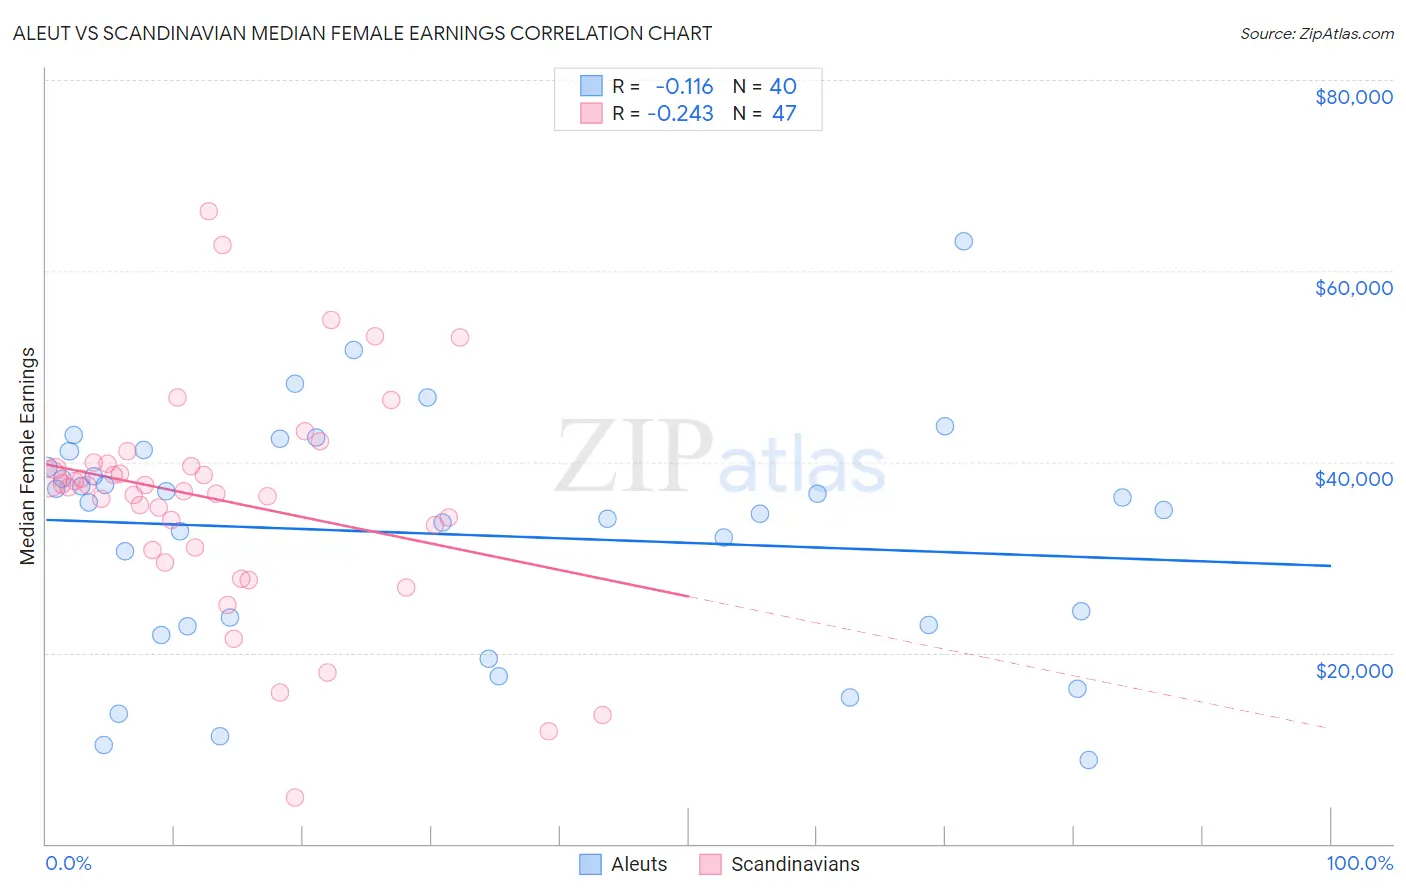
Aleut vs Scandinavian Median Female Earnings Correlation Chart
The statistical analysis conducted on geographies consisting of 61,761,178 people shows a poor negative correlation between the proportion of Aleuts and median female earnings in the United States with a correlation coefficient (R) of -0.116 and weighted average of $38,719. Similarly, the statistical analysis conducted on geographies consisting of 472,085,070 people shows a weak negative correlation between the proportion of Scandinavians and median female earnings in the United States with a correlation coefficient (R) of -0.243 and weighted average of $38,306, a difference of 1.1%.
Median Female Earnings Correlation Summary
| Measurement | Aleut | Scandinavian |
| Minimum | $8,750 | $4,824 |
| Maximum | $63,125 | $66,207 |
| Range | $54,375 | $61,383 |
| Mean | $32,459 | $35,901 |
| Median | $35,345 | $37,378 |
| Interquartile 25% (IQ1) | $22,835 | $30,708 |
| Interquartile 75% (IQ3) | $40,258 | $39,798 |
| Interquartile Range (IQR) | $17,423 | $9,090 |
| Standard Deviation (Sample) | $12,271 | $11,858 |
| Standard Deviation (Population) | $12,117 | $11,731 |
Similar Demographics by Median Female Earnings
Demographics Similar to Aleuts by Median Female Earnings
In terms of median female earnings, the demographic groups most similar to Aleuts are Guamanian/Chamorro ($38,717, a difference of 0.010%), Czechoslovakian ($38,738, a difference of 0.050%), Jamaican ($38,670, a difference of 0.13%), Iraqi ($38,666, a difference of 0.14%), and Spaniard ($38,656, a difference of 0.16%).
| Demographics | Rating | Rank | Median Female Earnings |
| Immigrants | Uruguay | 17.3 /100 | #204 | Poor $38,945 |
| Immigrants | Colombia | 16.3 /100 | #205 | Poor $38,913 |
| Immigrants | Bosnia and Herzegovina | 15.6 /100 | #206 | Poor $38,886 |
| Immigrants | Cambodia | 14.2 /100 | #207 | Poor $38,833 |
| Immigrants | Thailand | 13.6 /100 | #208 | Poor $38,810 |
| Norwegians | 13.4 /100 | #209 | Poor $38,802 |
| Czechoslovakians | 12.0 /100 | #210 | Poor $38,738 |
| Aleuts | 11.6 /100 | #211 | Poor $38,719 |
| Guamanians/Chamorros | 11.5 /100 | #212 | Poor $38,717 |
| Jamaicans | 10.5 /100 | #213 | Poor $38,670 |
| Iraqis | 10.5 /100 | #214 | Poor $38,666 |
| Spaniards | 10.3 /100 | #215 | Poor $38,656 |
| Immigrants | Ecuador | 10.1 /100 | #216 | Poor $38,644 |
| Immigrants | Jamaica | 9.7 /100 | #217 | Tragic $38,625 |
| Cape Verdeans | 9.5 /100 | #218 | Tragic $38,614 |
Demographics Similar to Scandinavians by Median Female Earnings
In terms of median female earnings, the demographic groups most similar to Scandinavians are Tongan ($38,288, a difference of 0.050%), Celtic ($38,283, a difference of 0.060%), Somali ($38,333, a difference of 0.070%), Basque ($38,352, a difference of 0.12%), and Belgian ($38,382, a difference of 0.20%).
| Demographics | Rating | Rank | Median Female Earnings |
| French | 7.0 /100 | #225 | Tragic $38,457 |
| French Canadians | 6.8 /100 | #226 | Tragic $38,436 |
| Scottish | 6.3 /100 | #227 | Tragic $38,397 |
| Sub-Saharan Africans | 6.2 /100 | #228 | Tragic $38,391 |
| Belgians | 6.1 /100 | #229 | Tragic $38,382 |
| Basques | 5.7 /100 | #230 | Tragic $38,352 |
| Somalis | 5.5 /100 | #231 | Tragic $38,333 |
| Scandinavians | 5.2 /100 | #232 | Tragic $38,306 |
| Tongans | 5.1 /100 | #233 | Tragic $38,288 |
| Celtics | 5.0 /100 | #234 | Tragic $38,283 |
| Sudanese | 4.4 /100 | #235 | Tragic $38,215 |
| Liberians | 4.4 /100 | #236 | Tragic $38,215 |
| Immigrants | Cabo Verde | 4.3 /100 | #237 | Tragic $38,208 |
| Alaska Natives | 4.3 /100 | #238 | Tragic $38,202 |
| English | 4.2 /100 | #239 | Tragic $38,196 |