Alaska Native vs Immigrants from Eritrea Male Unemployment
COMPARE
Alaska Native
Immigrants from Eritrea
Male Unemployment
Male Unemployment Comparison
Alaska Natives
Immigrants from Eritrea
8.1%
MALE UNEMPLOYMENT
0.0/ 100
METRIC RATING
331st/ 347
METRIC RANK
5.0%
MALE UNEMPLOYMENT
96.0/ 100
METRIC RATING
83rd/ 347
METRIC RANK
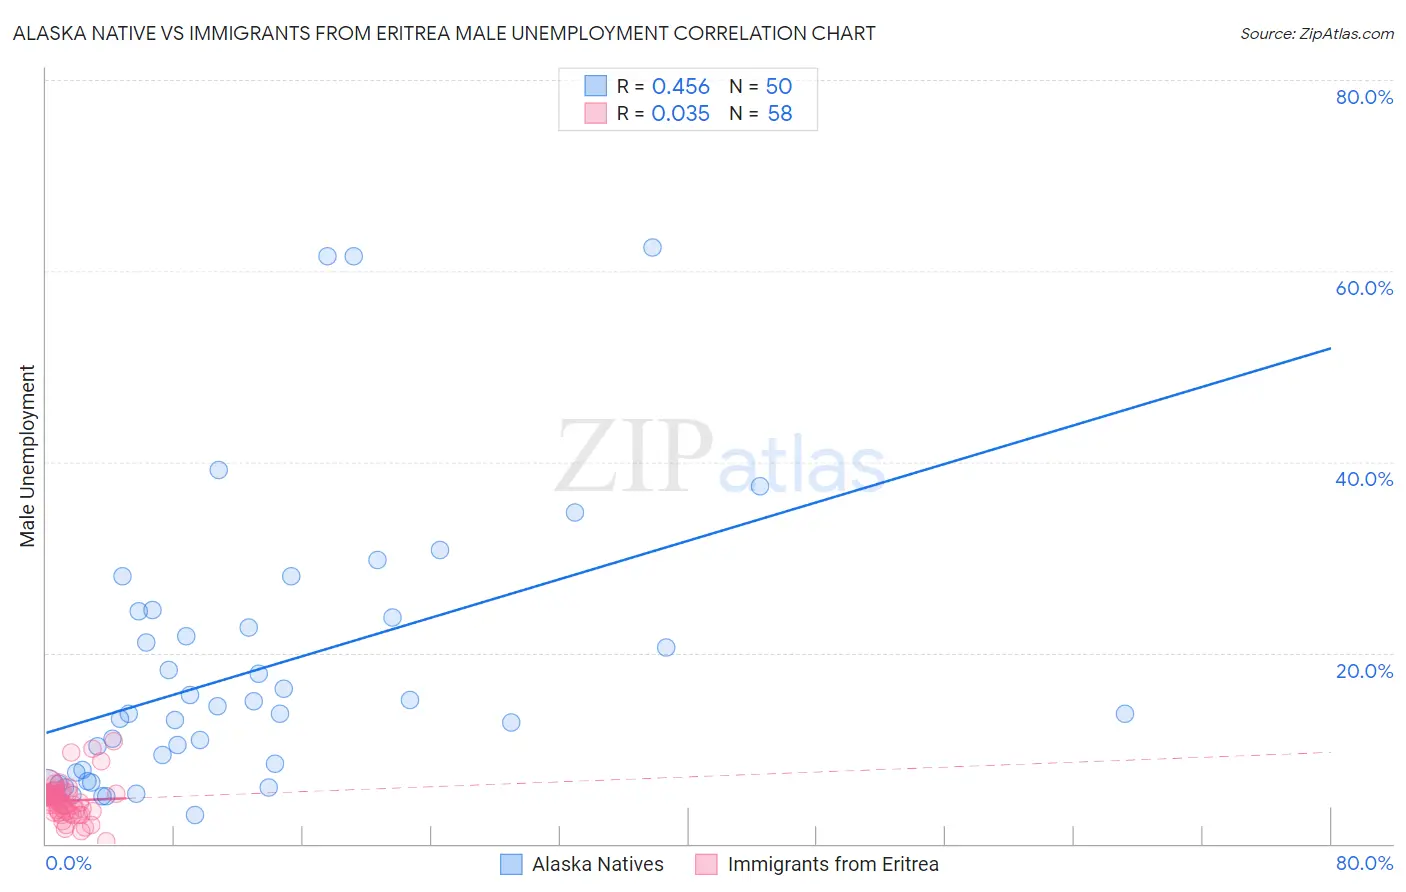
Alaska Native vs Immigrants from Eritrea Male Unemployment Correlation Chart
The statistical analysis conducted on geographies consisting of 76,676,462 people shows a moderate positive correlation between the proportion of Alaska Natives and unemployment rate among males in the United States with a correlation coefficient (R) of 0.456 and weighted average of 8.1%. Similarly, the statistical analysis conducted on geographies consisting of 104,807,981 people shows no correlation between the proportion of Immigrants from Eritrea and unemployment rate among males in the United States with a correlation coefficient (R) of 0.035 and weighted average of 5.0%, a difference of 60.0%.
Male Unemployment Correlation Summary
| Measurement | Alaska Native | Immigrants from Eritrea |
| Minimum | 3.0% | 0.20% |
| Maximum | 62.5% | 10.8% |
| Range | 59.5% | 10.6% |
| Mean | 18.1% | 4.5% |
| Median | 13.6% | 4.4% |
| Interquartile 25% (IQ1) | 7.5% | 3.4% |
| Interquartile 75% (IQ3) | 23.7% | 5.3% |
| Interquartile Range (IQR) | 16.2% | 1.9% |
| Standard Deviation (Sample) | 14.4% | 1.9% |
| Standard Deviation (Population) | 14.3% | 1.9% |
Similar Demographics by Male Unemployment
Demographics Similar to Alaska Natives by Male Unemployment
In terms of male unemployment, the demographic groups most similar to Alaska Natives are Yakama (7.9%, a difference of 1.9%), Pima (8.3%, a difference of 2.4%), Immigrants from Yemen (7.8%, a difference of 3.7%), Sioux (8.4%, a difference of 3.7%), and Native/Alaskan (7.7%, a difference of 4.7%).
| Demographics | Rating | Rank | Male Unemployment |
| Dominicans | 0.0 /100 | #324 | Tragic 7.6% |
| Shoshone | 0.0 /100 | #325 | Tragic 7.6% |
| Immigrants | Dominican Republic | 0.0 /100 | #326 | Tragic 7.6% |
| Paiute | 0.0 /100 | #327 | Tragic 7.7% |
| Natives/Alaskans | 0.0 /100 | #328 | Tragic 7.7% |
| Immigrants | Yemen | 0.0 /100 | #329 | Tragic 7.8% |
| Yakama | 0.0 /100 | #330 | Tragic 7.9% |
| Alaska Natives | 0.0 /100 | #331 | Tragic 8.1% |
| Pima | 0.0 /100 | #332 | Tragic 8.3% |
| Sioux | 0.0 /100 | #333 | Tragic 8.4% |
| Tsimshian | 0.0 /100 | #334 | Tragic 8.5% |
| Pueblo | 0.0 /100 | #335 | Tragic 8.5% |
| Yuman | 0.0 /100 | #336 | Tragic 8.6% |
| Puerto Ricans | 0.0 /100 | #337 | Tragic 8.6% |
| Apache | 0.0 /100 | #338 | Tragic 8.6% |
Demographics Similar to Immigrants from Eritrea by Male Unemployment
In terms of male unemployment, the demographic groups most similar to Immigrants from Eritrea are Chilean (5.0%, a difference of 0.060%), Argentinean (5.0%, a difference of 0.090%), French (5.0%, a difference of 0.090%), Serbian (5.1%, a difference of 0.12%), and South African (5.0%, a difference of 0.14%).
| Demographics | Rating | Rank | Male Unemployment |
| Immigrants | Sudan | 96.5 /100 | #76 | Exceptional 5.0% |
| Iranians | 96.4 /100 | #77 | Exceptional 5.0% |
| Immigrants | Northern Europe | 96.4 /100 | #78 | Exceptional 5.0% |
| South Africans | 96.4 /100 | #79 | Exceptional 5.0% |
| Argentineans | 96.2 /100 | #80 | Exceptional 5.0% |
| French | 96.2 /100 | #81 | Exceptional 5.0% |
| Chileans | 96.2 /100 | #82 | Exceptional 5.0% |
| Immigrants | Eritrea | 96.0 /100 | #83 | Exceptional 5.0% |
| Serbians | 95.7 /100 | #84 | Exceptional 5.1% |
| Immigrants | North Macedonia | 95.6 /100 | #85 | Exceptional 5.1% |
| Maltese | 95.5 /100 | #86 | Exceptional 5.1% |
| Immigrants | Romania | 95.4 /100 | #87 | Exceptional 5.1% |
| Immigrants | Sri Lanka | 94.9 /100 | #88 | Exceptional 5.1% |
| Immigrants | Australia | 94.7 /100 | #89 | Exceptional 5.1% |
| Okinawans | 94.7 /100 | #90 | Exceptional 5.1% |