Alaska Native vs Immigrants from Eritrea Householder Income Ages 25 - 44 years
COMPARE
Alaska Native
Immigrants from Eritrea
Householder Income Ages 25 - 44 years
Householder Income Ages 25 - 44 years Comparison
Alaska Natives
Immigrants from Eritrea
$88,018
HOUSEHOLDER INCOME AGES 25 - 44 YEARS
2.6/ 100
METRIC RATING
238th/ 347
METRIC RANK
$93,466
HOUSEHOLDER INCOME AGES 25 - 44 YEARS
35.2/ 100
METRIC RATING
185th/ 347
METRIC RANK
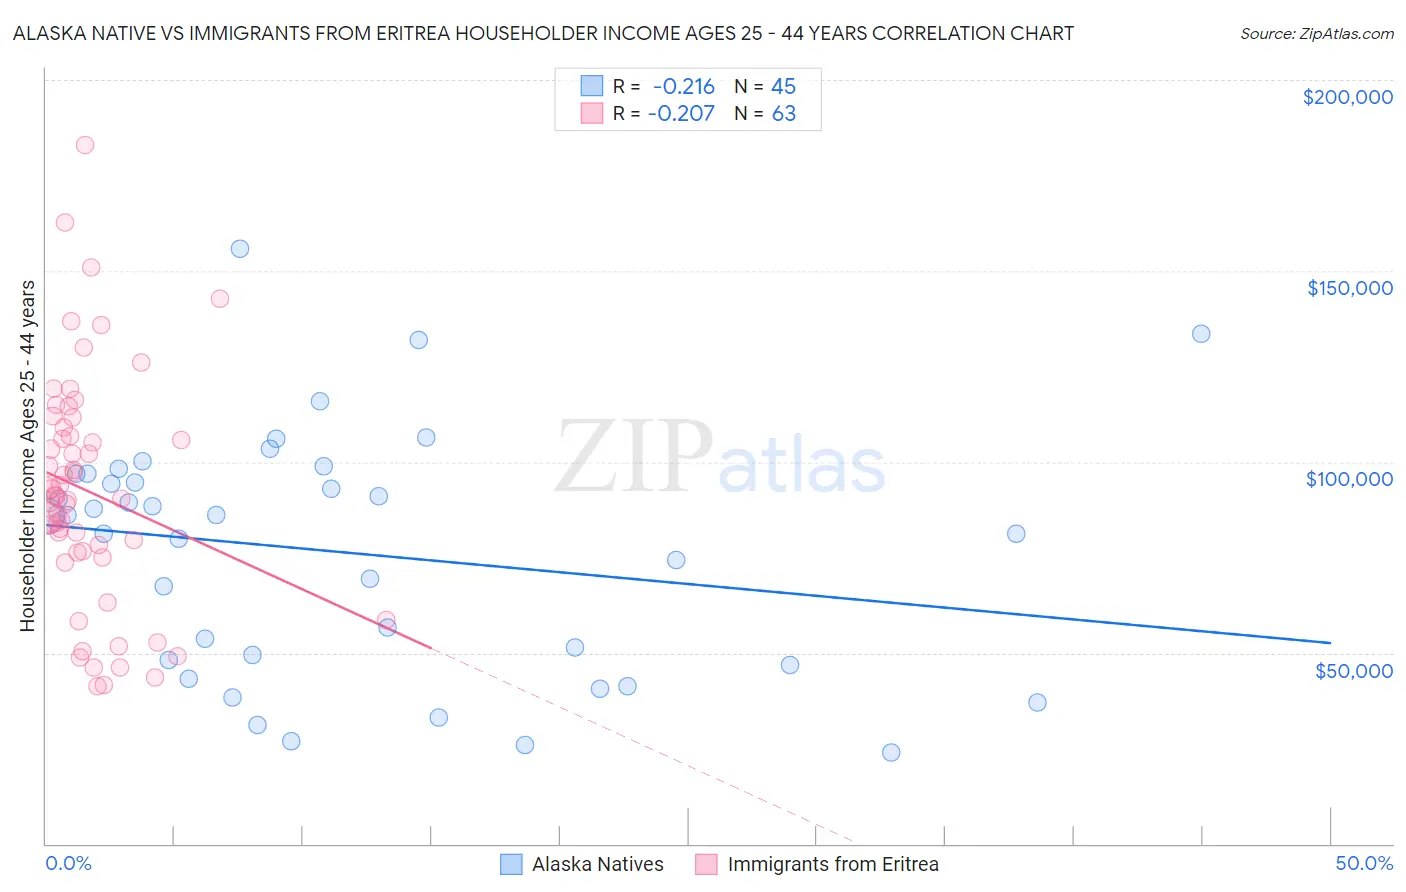
Alaska Native vs Immigrants from Eritrea Householder Income Ages 25 - 44 years Correlation Chart
The statistical analysis conducted on geographies consisting of 76,687,896 people shows a weak negative correlation between the proportion of Alaska Natives and household income with householder between the ages 25 and 44 in the United States with a correlation coefficient (R) of -0.216 and weighted average of $88,018. Similarly, the statistical analysis conducted on geographies consisting of 104,828,872 people shows a weak negative correlation between the proportion of Immigrants from Eritrea and household income with householder between the ages 25 and 44 in the United States with a correlation coefficient (R) of -0.207 and weighted average of $93,466, a difference of 6.2%.
Householder Income Ages 25 - 44 years Correlation Summary
| Measurement | Alaska Native | Immigrants from Eritrea |
| Minimum | $23,750 | $41,395 |
| Maximum | $155,658 | $183,112 |
| Range | $131,908 | $141,717 |
| Mean | $76,232 | $92,198 |
| Median | $85,753 | $91,003 |
| Interquartile 25% (IQ1) | $47,396 | $76,431 |
| Interquartile 75% (IQ3) | $96,980 | $109,130 |
| Interquartile Range (IQR) | $49,584 | $32,699 |
| Standard Deviation (Sample) | $31,478 | $30,253 |
| Standard Deviation (Population) | $31,126 | $30,012 |
Similar Demographics by Householder Income Ages 25 - 44 years
Demographics Similar to Alaska Natives by Householder Income Ages 25 - 44 years
In terms of householder income ages 25 - 44 years, the demographic groups most similar to Alaska Natives are Salvadoran ($88,198, a difference of 0.20%), Immigrants from Cameroon ($88,214, a difference of 0.22%), Venezuelan ($88,232, a difference of 0.24%), Bermudan ($88,231, a difference of 0.24%), and Immigrants from Ghana ($87,760, a difference of 0.29%).
| Demographics | Rating | Rank | Householder Income Ages 25 - 44 years |
| Immigrants | Grenada | 3.0 /100 | #231 | Tragic $88,311 |
| Immigrants | Nonimmigrants | 3.0 /100 | #232 | Tragic $88,301 |
| Malaysians | 3.0 /100 | #233 | Tragic $88,291 |
| Venezuelans | 2.9 /100 | #234 | Tragic $88,232 |
| Bermudans | 2.9 /100 | #235 | Tragic $88,231 |
| Immigrants | Cameroon | 2.9 /100 | #236 | Tragic $88,214 |
| Salvadorans | 2.8 /100 | #237 | Tragic $88,198 |
| Alaska Natives | 2.6 /100 | #238 | Tragic $88,018 |
| Immigrants | Ghana | 2.2 /100 | #239 | Tragic $87,760 |
| Nicaraguans | 2.2 /100 | #240 | Tragic $87,751 |
| Nigerians | 2.2 /100 | #241 | Tragic $87,730 |
| West Indians | 1.7 /100 | #242 | Tragic $87,205 |
| Immigrants | West Indies | 1.5 /100 | #243 | Tragic $87,063 |
| Immigrants | Venezuela | 1.5 /100 | #244 | Tragic $87,038 |
| Immigrants | El Salvador | 1.4 /100 | #245 | Tragic $86,913 |
Demographics Similar to Immigrants from Eritrea by Householder Income Ages 25 - 44 years
In terms of householder income ages 25 - 44 years, the demographic groups most similar to Immigrants from Eritrea are Sierra Leonean ($93,435, a difference of 0.030%), German ($93,531, a difference of 0.070%), Guamanian/Chamorro ($93,569, a difference of 0.11%), Spaniard ($93,366, a difference of 0.11%), and Uruguayan ($93,631, a difference of 0.18%).
| Demographics | Rating | Rank | Householder Income Ages 25 - 44 years |
| Immigrants | South America | 42.8 /100 | #178 | Average $94,042 |
| French Canadians | 38.2 /100 | #179 | Fair $93,694 |
| French | 37.8 /100 | #180 | Fair $93,665 |
| Puget Sound Salish | 37.7 /100 | #181 | Fair $93,661 |
| Uruguayans | 37.3 /100 | #182 | Fair $93,631 |
| Guamanians/Chamorros | 36.5 /100 | #183 | Fair $93,569 |
| Germans | 36.0 /100 | #184 | Fair $93,531 |
| Immigrants | Eritrea | 35.2 /100 | #185 | Fair $93,466 |
| Sierra Leoneans | 34.8 /100 | #186 | Fair $93,435 |
| Spaniards | 34.0 /100 | #187 | Fair $93,366 |
| Immigrants | Sierra Leone | 30.9 /100 | #188 | Fair $93,115 |
| Dutch | 30.5 /100 | #189 | Fair $93,081 |
| Welsh | 30.0 /100 | #190 | Fair $93,039 |
| Tlingit-Haida | 29.4 /100 | #191 | Fair $92,987 |
| Immigrants | Costa Rica | 28.2 /100 | #192 | Fair $92,876 |