Palestinian vs Immigrants from Caribbean Married-Couple Family Poverty
COMPARE
Palestinian
Immigrants from Caribbean
Married-Couple Family Poverty
Married-Couple Family Poverty Comparison
Palestinians
Immigrants from Caribbean
4.9%
MARRIED-COUPLE FAMILY POVERTY
91.2/ 100
METRIC RATING
128th/ 347
METRIC RANK
7.3%
MARRIED-COUPLE FAMILY POVERTY
0.0/ 100
METRIC RATING
321st/ 347
METRIC RANK
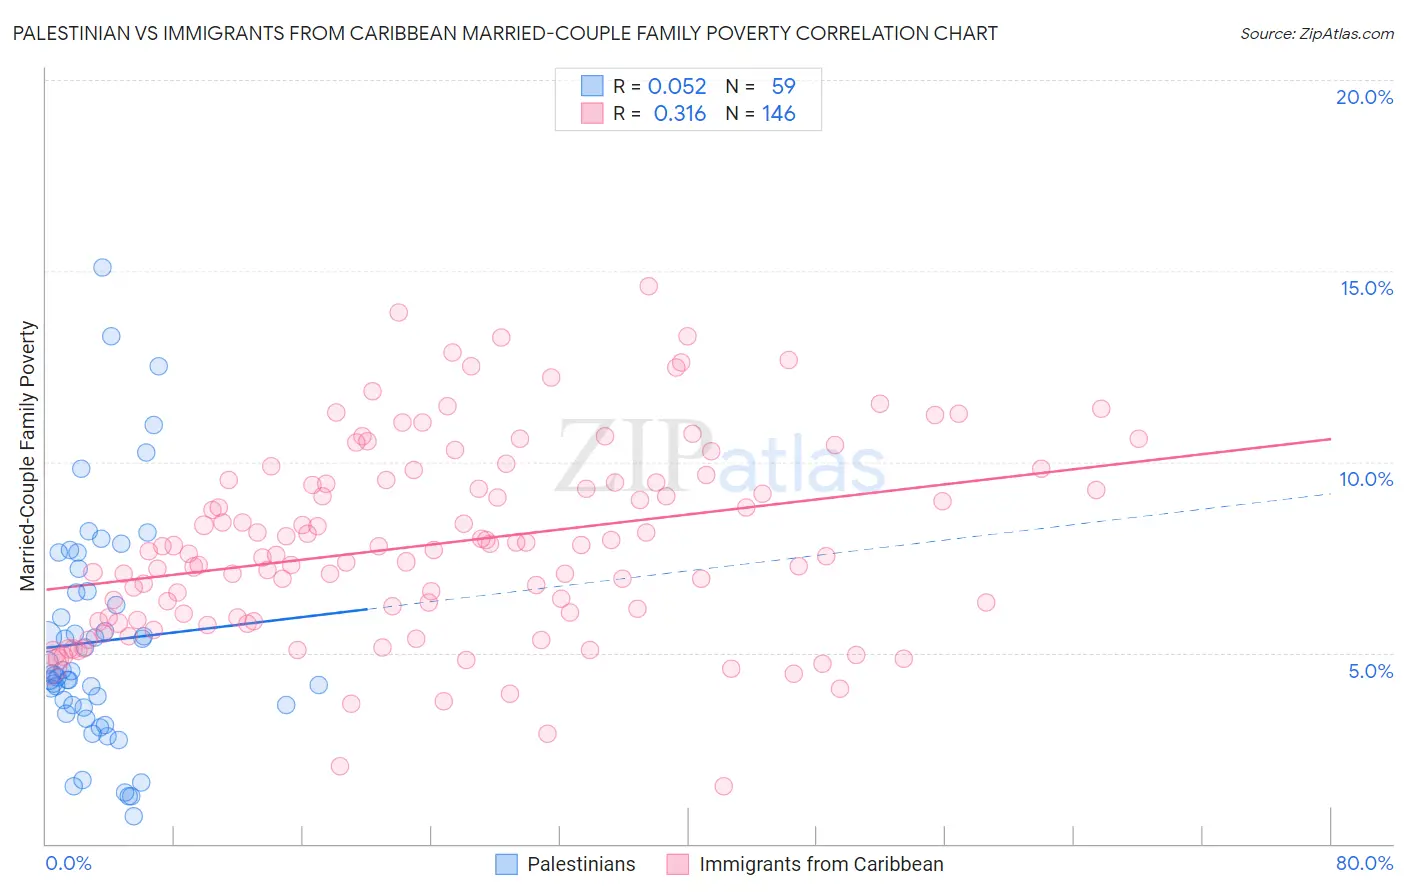
Palestinian vs Immigrants from Caribbean Married-Couple Family Poverty Correlation Chart
The statistical analysis conducted on geographies consisting of 215,628,863 people shows a slight positive correlation between the proportion of Palestinians and poverty level among married-couple families in the United States with a correlation coefficient (R) of 0.052 and weighted average of 4.9%. Similarly, the statistical analysis conducted on geographies consisting of 444,708,318 people shows a mild positive correlation between the proportion of Immigrants from Caribbean and poverty level among married-couple families in the United States with a correlation coefficient (R) of 0.316 and weighted average of 7.3%, a difference of 51.0%.
Married-Couple Family Poverty Correlation Summary
| Measurement | Palestinian | Immigrants from Caribbean |
| Minimum | 0.73% | 1.5% |
| Maximum | 15.1% | 14.6% |
| Range | 14.3% | 13.1% |
| Mean | 5.3% | 7.9% |
| Median | 4.4% | 7.7% |
| Interquartile 25% (IQ1) | 3.6% | 5.9% |
| Interquartile 75% (IQ3) | 6.6% | 9.4% |
| Interquartile Range (IQR) | 3.0% | 3.5% |
| Standard Deviation (Sample) | 3.0% | 2.5% |
| Standard Deviation (Population) | 3.0% | 2.5% |
Similar Demographics by Married-Couple Family Poverty
Demographics Similar to Palestinians by Married-Couple Family Poverty
In terms of married-couple family poverty, the demographic groups most similar to Palestinians are Immigrants from Pakistan (4.9%, a difference of 0.20%), Soviet Union (4.9%, a difference of 0.21%), Immigrants from Eastern Europe (4.9%, a difference of 0.28%), Puget Sound Salish (4.9%, a difference of 0.29%), and Egyptian (4.8%, a difference of 0.32%).
| Demographics | Rating | Rank | Married-Couple Family Poverty |
| Indians (Asian) | 93.2 /100 | #121 | Exceptional 4.8% |
| Whites/Caucasians | 93.1 /100 | #122 | Exceptional 4.8% |
| Jordanians | 93.1 /100 | #123 | Exceptional 4.8% |
| Romanians | 92.5 /100 | #124 | Exceptional 4.8% |
| Immigrants | Bosnia and Herzegovina | 92.5 /100 | #125 | Exceptional 4.8% |
| Immigrants | Asia | 92.3 /100 | #126 | Exceptional 4.8% |
| Egyptians | 92.0 /100 | #127 | Exceptional 4.8% |
| Palestinians | 91.2 /100 | #128 | Exceptional 4.9% |
| Immigrants | Pakistan | 90.7 /100 | #129 | Exceptional 4.9% |
| Soviet Union | 90.7 /100 | #130 | Exceptional 4.9% |
| Immigrants | Eastern Europe | 90.5 /100 | #131 | Exceptional 4.9% |
| Puget Sound Salish | 90.4 /100 | #132 | Exceptional 4.9% |
| Immigrants | Kenya | 90.2 /100 | #133 | Exceptional 4.9% |
| Samoans | 90.2 /100 | #134 | Exceptional 4.9% |
| Assyrians/Chaldeans/Syriacs | 89.4 /100 | #135 | Excellent 4.9% |
Demographics Similar to Immigrants from Caribbean by Married-Couple Family Poverty
In terms of married-couple family poverty, the demographic groups most similar to Immigrants from Caribbean are Immigrants from Honduras (7.3%, a difference of 0.030%), Immigrants from Grenada (7.3%, a difference of 0.77%), Vietnamese (7.4%, a difference of 1.1%), Immigrants from Central America (7.4%, a difference of 1.2%), and Immigrants from Cuba (7.5%, a difference of 1.7%).
| Demographics | Rating | Rank | Married-Couple Family Poverty |
| British West Indians | 0.0 /100 | #314 | Tragic 7.1% |
| Inupiat | 0.0 /100 | #315 | Tragic 7.1% |
| Hondurans | 0.0 /100 | #316 | Tragic 7.2% |
| Mexicans | 0.0 /100 | #317 | Tragic 7.2% |
| Immigrants | Guatemala | 0.0 /100 | #318 | Tragic 7.2% |
| Immigrants | Latin America | 0.0 /100 | #319 | Tragic 7.2% |
| Immigrants | Grenada | 0.0 /100 | #320 | Tragic 7.3% |
| Immigrants | Caribbean | 0.0 /100 | #321 | Tragic 7.3% |
| Immigrants | Honduras | 0.0 /100 | #322 | Tragic 7.3% |
| Vietnamese | 0.0 /100 | #323 | Tragic 7.4% |
| Immigrants | Central America | 0.0 /100 | #324 | Tragic 7.4% |
| Immigrants | Cuba | 0.0 /100 | #325 | Tragic 7.5% |
| Immigrants | Bangladesh | 0.0 /100 | #326 | Tragic 7.5% |
| Hispanics or Latinos | 0.0 /100 | #327 | Tragic 7.5% |
| Immigrants | Mexico | 0.0 /100 | #328 | Tragic 7.6% |