African vs Immigrants from Grenada 5th Grade
COMPARE
African
Immigrants from Grenada
5th Grade
5th Grade Comparison
Africans
Immigrants from Grenada
97.2%
5TH GRADE
15.3/ 100
METRIC RATING
202nd/ 347
METRIC RANK
96.5%
5TH GRADE
0.0/ 100
METRIC RATING
293rd/ 347
METRIC RANK
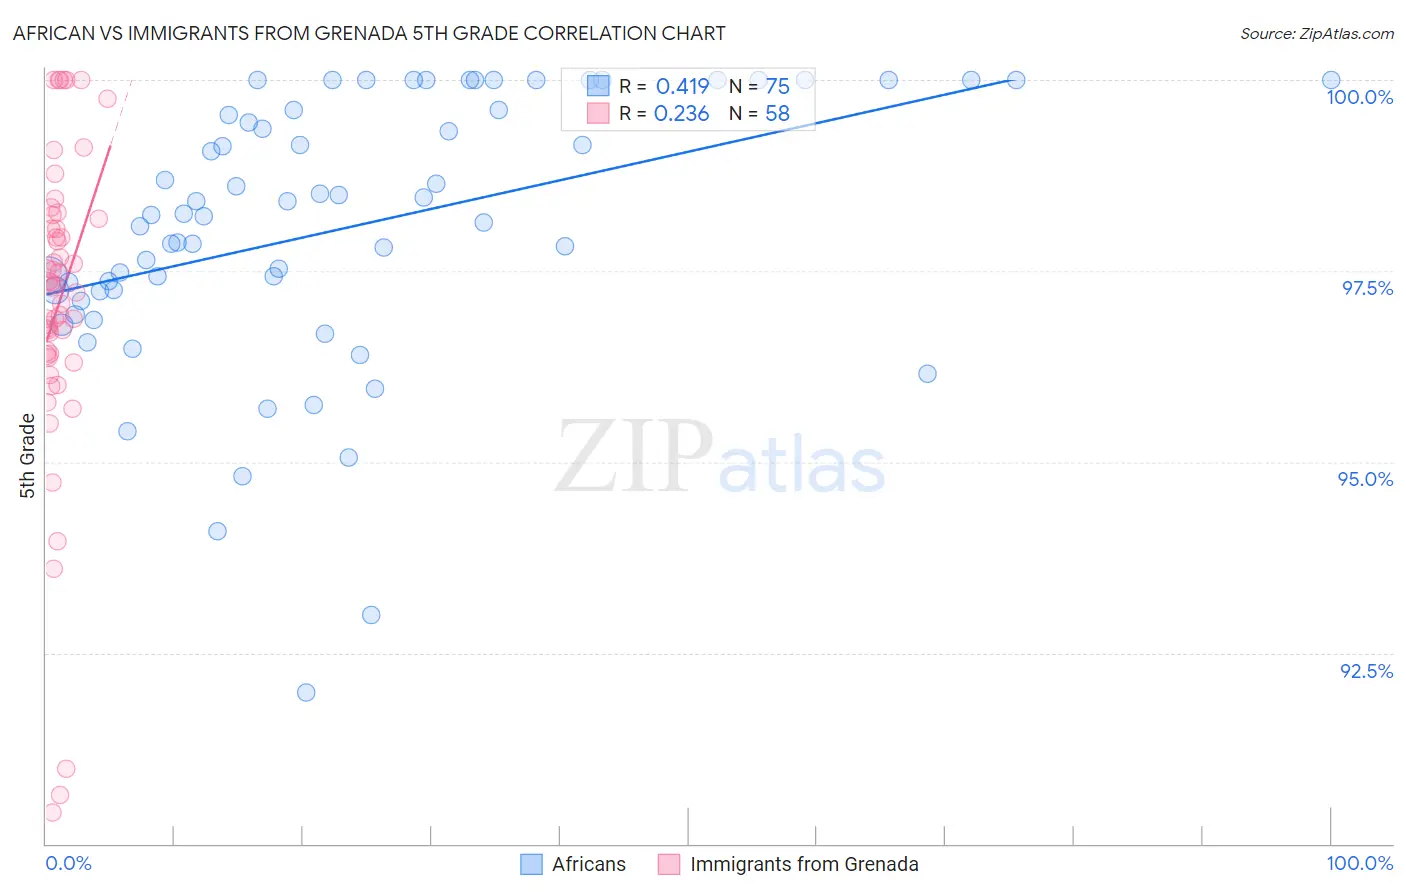
African vs Immigrants from Grenada 5th Grade Correlation Chart
The statistical analysis conducted on geographies consisting of 470,094,744 people shows a moderate positive correlation between the proportion of Africans and percentage of population with at least 5th grade education in the United States with a correlation coefficient (R) of 0.419 and weighted average of 97.2%. Similarly, the statistical analysis conducted on geographies consisting of 67,199,790 people shows a weak positive correlation between the proportion of Immigrants from Grenada and percentage of population with at least 5th grade education in the United States with a correlation coefficient (R) of 0.236 and weighted average of 96.5%, a difference of 0.72%.
5th Grade Correlation Summary
| Measurement | African | Immigrants from Grenada |
| Minimum | 92.0% | 90.4% |
| Maximum | 100.0% | 100.0% |
| Range | 8.0% | 9.6% |
| Mean | 98.1% | 97.1% |
| Median | 98.2% | 97.3% |
| Interquartile 25% (IQ1) | 97.2% | 96.4% |
| Interquartile 75% (IQ3) | 99.6% | 98.2% |
| Interquartile Range (IQR) | 2.4% | 1.8% |
| Standard Deviation (Sample) | 1.8% | 2.1% |
| Standard Deviation (Population) | 1.8% | 2.1% |
Similar Demographics by 5th Grade
Demographics Similar to Africans by 5th Grade
In terms of 5th grade, the demographic groups most similar to Africans are Immigrants from Bahamas (97.2%, a difference of 0.0%), Immigrants from Northern Africa (97.2%, a difference of 0.010%), Immigrants from Chile (97.2%, a difference of 0.010%), Immigrants from Zaire (97.1%, a difference of 0.010%), and Native/Alaskan (97.2%, a difference of 0.020%).
| Demographics | Rating | Rank | 5th Grade |
| Guamanians/Chamorros | 26.8 /100 | #195 | Fair 97.2% |
| Hawaiians | 25.6 /100 | #196 | Fair 97.2% |
| Brazilians | 25.4 /100 | #197 | Fair 97.2% |
| Immigrants | Uganda | 21.1 /100 | #198 | Fair 97.2% |
| Natives/Alaskans | 18.0 /100 | #199 | Poor 97.2% |
| Immigrants | Northern Africa | 16.8 /100 | #200 | Poor 97.2% |
| Immigrants | Chile | 16.6 /100 | #201 | Poor 97.2% |
| Africans | 15.3 /100 | #202 | Poor 97.2% |
| Immigrants | Bahamas | 14.9 /100 | #203 | Poor 97.2% |
| Immigrants | Zaire | 13.7 /100 | #204 | Poor 97.1% |
| Moroccans | 12.0 /100 | #205 | Poor 97.1% |
| Paiute | 11.6 /100 | #206 | Poor 97.1% |
| Iraqis | 10.9 /100 | #207 | Poor 97.1% |
| Laotians | 10.8 /100 | #208 | Poor 97.1% |
| Immigrants | Nepal | 10.3 /100 | #209 | Poor 97.1% |
Demographics Similar to Immigrants from Grenada by 5th Grade
In terms of 5th grade, the demographic groups most similar to Immigrants from Grenada are Somali (96.5%, a difference of 0.010%), British West Indian (96.5%, a difference of 0.020%), Malaysian (96.5%, a difference of 0.020%), Immigrants from West Indies (96.5%, a difference of 0.040%), and Immigrants from Eritrea (96.4%, a difference of 0.040%).
| Demographics | Rating | Rank | 5th Grade |
| Immigrants | Thailand | 0.1 /100 | #286 | Tragic 96.6% |
| Immigrants | Afghanistan | 0.1 /100 | #287 | Tragic 96.6% |
| Immigrants | Barbados | 0.0 /100 | #288 | Tragic 96.6% |
| Immigrants | West Indies | 0.0 /100 | #289 | Tragic 96.5% |
| British West Indians | 0.0 /100 | #290 | Tragic 96.5% |
| Malaysians | 0.0 /100 | #291 | Tragic 96.5% |
| Somalis | 0.0 /100 | #292 | Tragic 96.5% |
| Immigrants | Grenada | 0.0 /100 | #293 | Tragic 96.5% |
| Immigrants | Eritrea | 0.0 /100 | #294 | Tragic 96.4% |
| Immigrants | Somalia | 0.0 /100 | #295 | Tragic 96.4% |
| Immigrants | South Eastern Asia | 0.0 /100 | #296 | Tragic 96.3% |
| Haitians | 0.0 /100 | #297 | Tragic 96.3% |
| Immigrants | Dominica | 0.0 /100 | #298 | Tragic 96.2% |
| Immigrants | Immigrants | 0.0 /100 | #299 | Tragic 96.2% |
| Sri Lankans | 0.0 /100 | #300 | Tragic 96.1% |