African vs Immigrants from Grenada 11th Grade
COMPARE
African
Immigrants from Grenada
11th Grade
11th Grade Comparison
Africans
Immigrants from Grenada
91.5%
11TH GRADE
1.3/ 100
METRIC RATING
245th/ 347
METRIC RANK
90.1%
11TH GRADE
0.0/ 100
METRIC RATING
294th/ 347
METRIC RANK
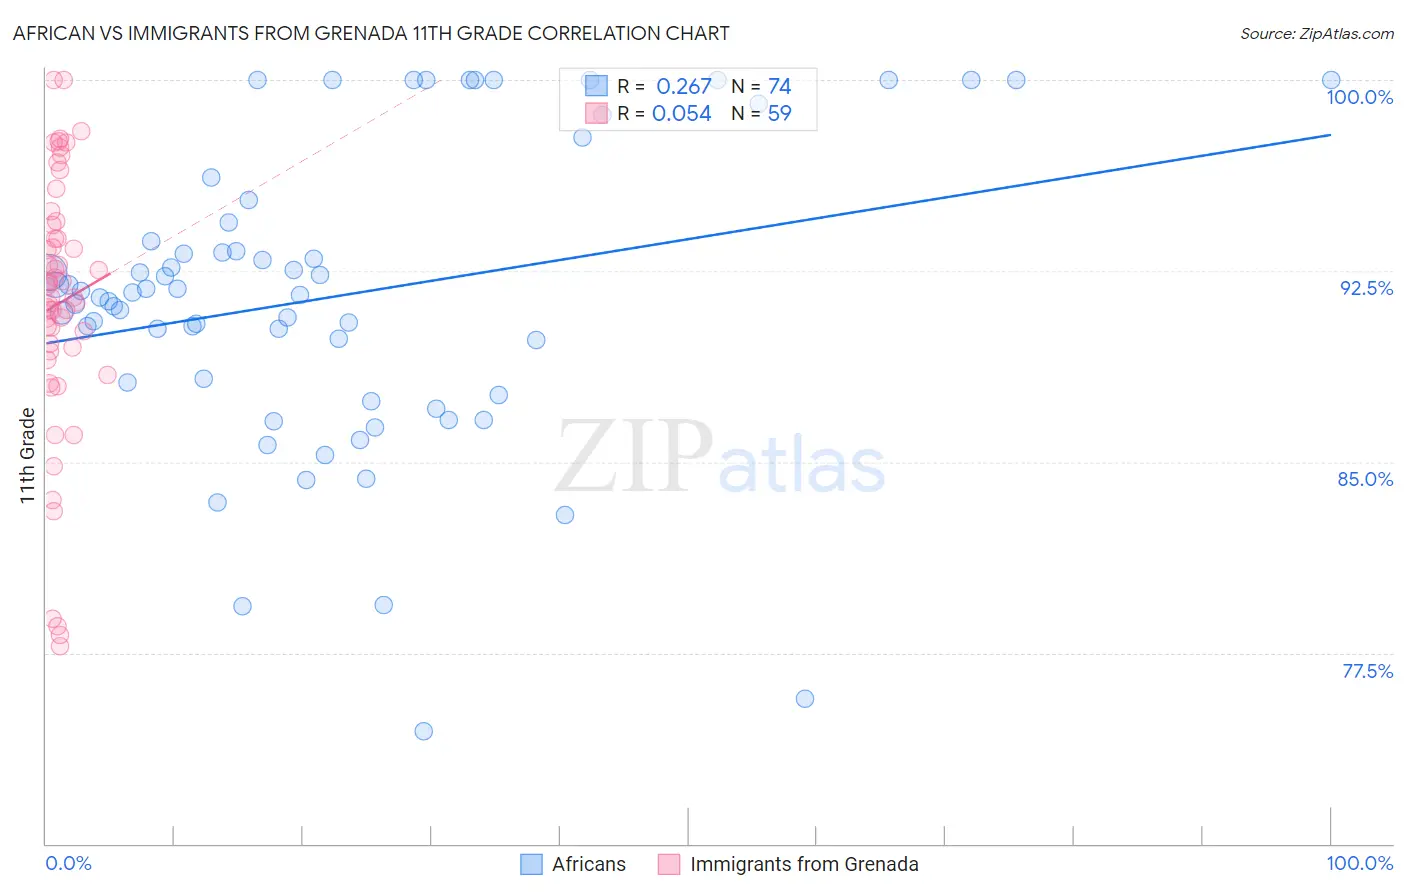
African vs Immigrants from Grenada 11th Grade Correlation Chart
The statistical analysis conducted on geographies consisting of 470,094,658 people shows a weak positive correlation between the proportion of Africans and percentage of population with at least 11th grade education in the United States with a correlation coefficient (R) of 0.267 and weighted average of 91.5%. Similarly, the statistical analysis conducted on geographies consisting of 67,201,908 people shows a slight positive correlation between the proportion of Immigrants from Grenada and percentage of population with at least 11th grade education in the United States with a correlation coefficient (R) of 0.054 and weighted average of 90.1%, a difference of 1.5%.
11th Grade Correlation Summary
| Measurement | African | Immigrants from Grenada |
| Minimum | 74.4% | 77.8% |
| Maximum | 100.0% | 100.0% |
| Range | 25.6% | 22.2% |
| Mean | 91.5% | 91.2% |
| Median | 91.6% | 91.5% |
| Interquartile 25% (IQ1) | 88.1% | 89.4% |
| Interquartile 75% (IQ3) | 94.4% | 94.3% |
| Interquartile Range (IQR) | 6.3% | 5.0% |
| Standard Deviation (Sample) | 5.9% | 5.1% |
| Standard Deviation (Population) | 5.8% | 5.1% |
Similar Demographics by 11th Grade
Demographics Similar to Africans by 11th Grade
In terms of 11th grade, the demographic groups most similar to Africans are Senegalese (91.6%, a difference of 0.010%), Immigrants from Thailand (91.6%, a difference of 0.020%), Seminole (91.5%, a difference of 0.030%), Immigrants from Middle Africa (91.6%, a difference of 0.050%), and Immigrants from Philippines (91.5%, a difference of 0.070%).
| Demographics | Rating | Rank | 11th Grade |
| Comanche | 2.6 /100 | #238 | Tragic 91.7% |
| Hopi | 2.5 /100 | #239 | Tragic 91.7% |
| South Americans | 2.0 /100 | #240 | Tragic 91.6% |
| Bahamians | 1.8 /100 | #241 | Tragic 91.6% |
| Immigrants | Middle Africa | 1.6 /100 | #242 | Tragic 91.6% |
| Immigrants | Thailand | 1.4 /100 | #243 | Tragic 91.6% |
| Senegalese | 1.4 /100 | #244 | Tragic 91.6% |
| Africans | 1.3 /100 | #245 | Tragic 91.5% |
| Seminole | 1.2 /100 | #246 | Tragic 91.5% |
| Immigrants | Philippines | 1.0 /100 | #247 | Tragic 91.5% |
| Immigrants | Uzbekistan | 1.0 /100 | #248 | Tragic 91.5% |
| Peruvians | 1.0 /100 | #249 | Tragic 91.5% |
| Ghanaians | 0.9 /100 | #250 | Tragic 91.5% |
| Immigrants | Costa Rica | 0.9 /100 | #251 | Tragic 91.4% |
| Immigrants | Nigeria | 0.8 /100 | #252 | Tragic 91.4% |
Demographics Similar to Immigrants from Grenada by 11th Grade
In terms of 11th grade, the demographic groups most similar to Immigrants from Grenada are Native/Alaskan (90.2%, a difference of 0.050%), Immigrants from Vietnam (90.0%, a difference of 0.11%), Cuban (90.2%, a difference of 0.12%), Fijian (90.0%, a difference of 0.12%), and Haitian (90.3%, a difference of 0.14%).
| Demographics | Rating | Rank | 11th Grade |
| Apache | 0.0 /100 | #287 | Tragic 90.4% |
| Pennsylvania Germans | 0.0 /100 | #288 | Tragic 90.3% |
| British West Indians | 0.0 /100 | #289 | Tragic 90.3% |
| Indonesians | 0.0 /100 | #290 | Tragic 90.3% |
| Haitians | 0.0 /100 | #291 | Tragic 90.3% |
| Cubans | 0.0 /100 | #292 | Tragic 90.2% |
| Natives/Alaskans | 0.0 /100 | #293 | Tragic 90.2% |
| Immigrants | Grenada | 0.0 /100 | #294 | Tragic 90.1% |
| Immigrants | Vietnam | 0.0 /100 | #295 | Tragic 90.0% |
| Fijians | 0.0 /100 | #296 | Tragic 90.0% |
| Navajo | 0.0 /100 | #297 | Tragic 90.0% |
| Immigrants | Fiji | 0.0 /100 | #298 | Tragic 89.9% |
| Japanese | 0.0 /100 | #299 | Tragic 89.9% |
| Immigrants | Haiti | 0.0 /100 | #300 | Tragic 89.9% |
| Guyanese | 0.0 /100 | #301 | Tragic 89.9% |