Afghan vs Puget Sound Salish Single Mother Poverty
COMPARE
Afghan
Puget Sound Salish
Single Mother Poverty
Single Mother Poverty Comparison
Afghans
Puget Sound Salish
27.7%
SINGLE MOTHER POVERTY
98.5/ 100
METRIC RATING
87th/ 347
METRIC RANK
29.1%
SINGLE MOTHER POVERTY
55.1/ 100
METRIC RATING
171st/ 347
METRIC RANK
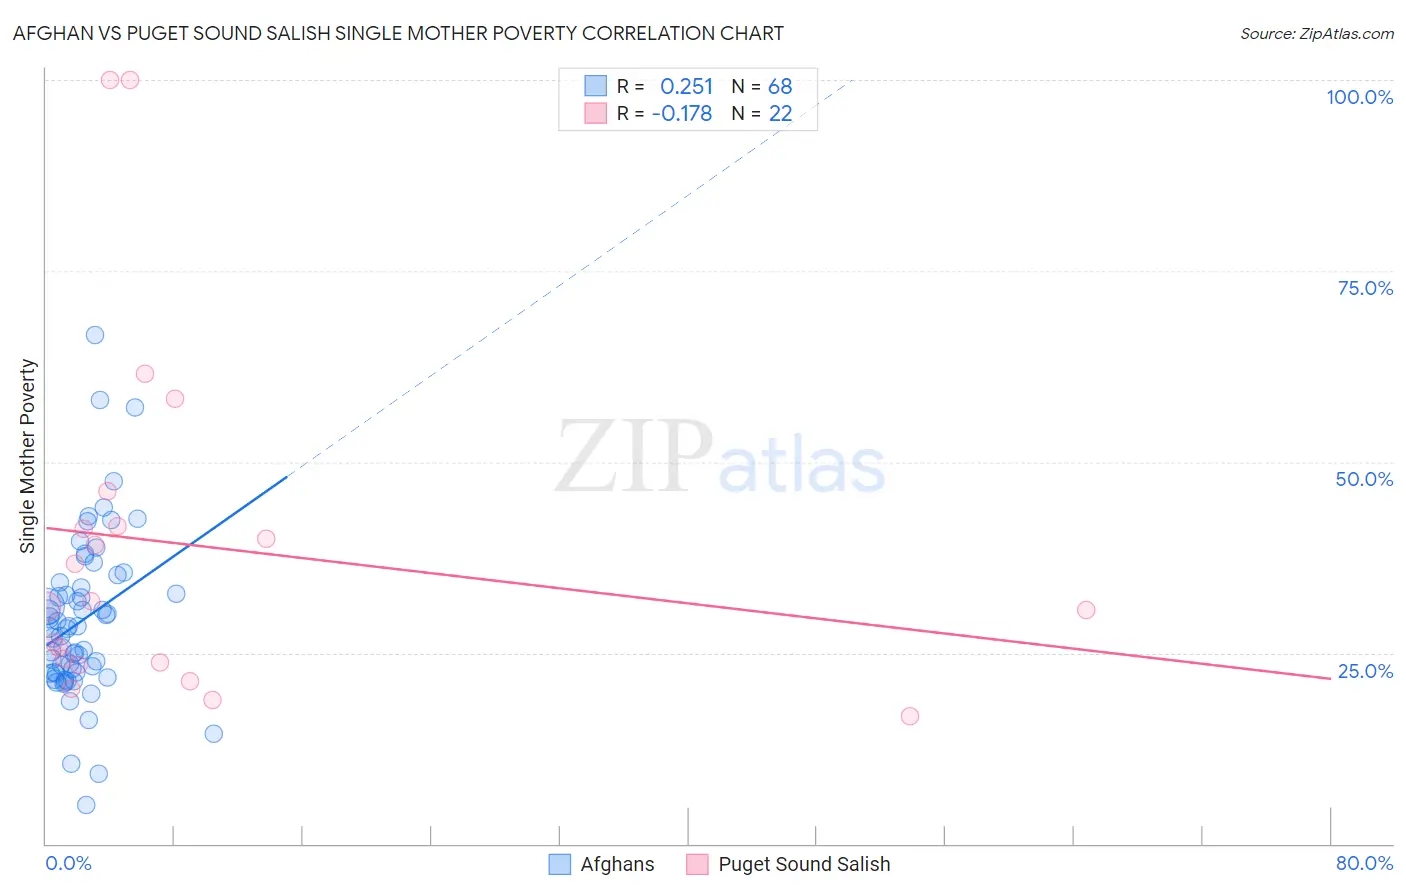
Afghan vs Puget Sound Salish Single Mother Poverty Correlation Chart
The statistical analysis conducted on geographies consisting of 147,050,043 people shows a weak positive correlation between the proportion of Afghans and poverty level among single mothers in the United States with a correlation coefficient (R) of 0.251 and weighted average of 27.7%. Similarly, the statistical analysis conducted on geographies consisting of 45,775,408 people shows a poor negative correlation between the proportion of Puget Sound Salish and poverty level among single mothers in the United States with a correlation coefficient (R) of -0.178 and weighted average of 29.1%, a difference of 5.0%.
Single Mother Poverty Correlation Summary
| Measurement | Afghan | Puget Sound Salish |
| Minimum | 5.1% | 16.7% |
| Maximum | 66.7% | 100.0% |
| Range | 61.5% | 83.3% |
| Mean | 29.3% | 39.0% |
| Median | 28.2% | 31.4% |
| Interquartile 25% (IQ1) | 22.4% | 23.7% |
| Interquartile 75% (IQ3) | 33.9% | 41.6% |
| Interquartile Range (IQR) | 11.6% | 17.9% |
| Standard Deviation (Sample) | 10.8% | 23.1% |
| Standard Deviation (Population) | 10.7% | 22.5% |
Similar Demographics by Single Mother Poverty
Demographics Similar to Afghans by Single Mother Poverty
In terms of single mother poverty, the demographic groups most similar to Afghans are Ethiopian (27.7%, a difference of 0.020%), Immigrants from Ethiopia (27.7%, a difference of 0.040%), Immigrants from Ukraine (27.7%, a difference of 0.10%), Mongolian (27.7%, a difference of 0.19%), and Immigrants from Latvia (27.7%, a difference of 0.20%).
| Demographics | Rating | Rank | Single Mother Poverty |
| Taiwanese | 99.1 /100 | #80 | Exceptional 27.5% |
| Immigrants | Scotland | 98.9 /100 | #81 | Exceptional 27.6% |
| Immigrants | Cameroon | 98.8 /100 | #82 | Exceptional 27.6% |
| Greeks | 98.7 /100 | #83 | Exceptional 27.7% |
| Immigrants | Latvia | 98.7 /100 | #84 | Exceptional 27.7% |
| Mongolians | 98.7 /100 | #85 | Exceptional 27.7% |
| Immigrants | Ukraine | 98.6 /100 | #86 | Exceptional 27.7% |
| Afghans | 98.5 /100 | #87 | Exceptional 27.7% |
| Ethiopians | 98.4 /100 | #88 | Exceptional 27.7% |
| Immigrants | Ethiopia | 98.4 /100 | #89 | Exceptional 27.7% |
| Immigrants | France | 98.2 /100 | #90 | Exceptional 27.8% |
| Immigrants | Albania | 98.0 /100 | #91 | Exceptional 27.8% |
| Estonians | 97.9 /100 | #92 | Exceptional 27.8% |
| Romanians | 97.8 /100 | #93 | Exceptional 27.8% |
| Albanians | 97.6 /100 | #94 | Exceptional 27.9% |
Demographics Similar to Puget Sound Salish by Single Mother Poverty
In terms of single mother poverty, the demographic groups most similar to Puget Sound Salish are New Zealander (29.1%, a difference of 0.0%), Carpatho Rusyn (29.1%, a difference of 0.060%), Immigrants from Uruguay (29.1%, a difference of 0.11%), European (29.1%, a difference of 0.12%), and Costa Rican (29.0%, a difference of 0.16%).
| Demographics | Rating | Rank | Single Mother Poverty |
| Immigrants | Kenya | 65.9 /100 | #164 | Good 28.9% |
| Arabs | 60.7 /100 | #165 | Good 29.0% |
| Inupiat | 60.4 /100 | #166 | Good 29.0% |
| Costa Ricans | 58.4 /100 | #167 | Average 29.0% |
| Europeans | 57.6 /100 | #168 | Average 29.1% |
| Immigrants | Uruguay | 57.2 /100 | #169 | Average 29.1% |
| New Zealanders | 55.1 /100 | #170 | Average 29.1% |
| Puget Sound Salish | 55.1 /100 | #171 | Average 29.1% |
| Carpatho Rusyns | 53.8 /100 | #172 | Average 29.1% |
| British | 50.6 /100 | #173 | Average 29.2% |
| Immigrants | Saudi Arabia | 50.0 /100 | #174 | Average 29.2% |
| Immigrants | Costa Rica | 48.8 /100 | #175 | Average 29.2% |
| Hawaiians | 47.8 /100 | #176 | Average 29.2% |
| Immigrants | Bosnia and Herzegovina | 45.1 /100 | #177 | Average 29.2% |
| South American Indians | 43.2 /100 | #178 | Average 29.3% |