Afghan vs Lithuanian Single Male Poverty
COMPARE
Afghan
Lithuanian
Single Male Poverty
Single Male Poverty Comparison
Afghans
Lithuanians
10.7%
SINGLE MALE POVERTY
100.0/ 100
METRIC RATING
7th/ 347
METRIC RANK
13.0%
SINGLE MALE POVERTY
22.1/ 100
METRIC RATING
198th/ 347
METRIC RANK
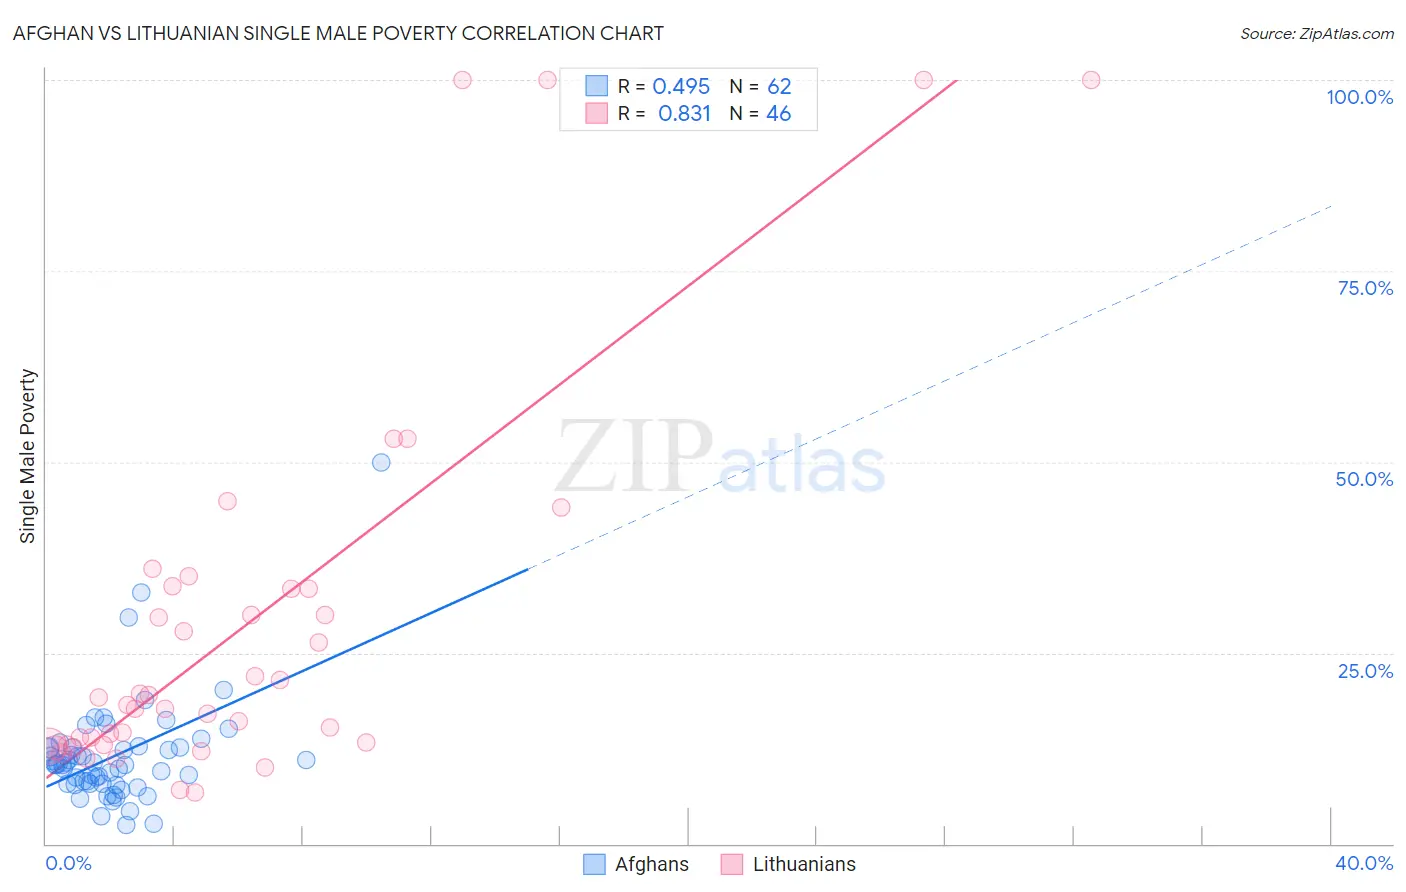
Afghan vs Lithuanian Single Male Poverty Correlation Chart
The statistical analysis conducted on geographies consisting of 140,679,200 people shows a moderate positive correlation between the proportion of Afghans and poverty level among single males in the United States with a correlation coefficient (R) of 0.495 and weighted average of 10.7%. Similarly, the statistical analysis conducted on geographies consisting of 363,241,212 people shows a very strong positive correlation between the proportion of Lithuanians and poverty level among single males in the United States with a correlation coefficient (R) of 0.831 and weighted average of 13.0%, a difference of 21.5%.
Single Male Poverty Correlation Summary
| Measurement | Afghan | Lithuanian |
| Minimum | 2.4% | 6.7% |
| Maximum | 50.0% | 100.0% |
| Range | 47.6% | 93.3% |
| Mean | 11.5% | 28.6% |
| Median | 10.3% | 18.7% |
| Interquartile 25% (IQ1) | 7.8% | 12.9% |
| Interquartile 75% (IQ3) | 12.6% | 33.3% |
| Interquartile Range (IQR) | 4.8% | 20.5% |
| Standard Deviation (Sample) | 7.2% | 25.0% |
| Standard Deviation (Population) | 7.2% | 24.8% |
Similar Demographics by Single Male Poverty
Demographics Similar to Afghans by Single Male Poverty
In terms of single male poverty, the demographic groups most similar to Afghans are Thai (10.8%, a difference of 0.47%), Filipino (10.6%, a difference of 0.75%), Taiwanese (10.9%, a difference of 1.7%), Immigrants from Fiji (10.9%, a difference of 1.8%), and Immigrants from Philippines (10.9%, a difference of 1.8%).
| Demographics | Rating | Rank | Single Male Poverty |
| Assyrians/Chaldeans/Syriacs | 100.0 /100 | #1 | Exceptional 9.8% |
| Immigrants | Taiwan | 100.0 /100 | #2 | Exceptional 10.3% |
| Immigrants | India | 100.0 /100 | #3 | Exceptional 10.3% |
| Immigrants | Hong Kong | 100.0 /100 | #4 | Exceptional 10.4% |
| Tongans | 100.0 /100 | #5 | Exceptional 10.5% |
| Filipinos | 100.0 /100 | #6 | Exceptional 10.6% |
| Afghans | 100.0 /100 | #7 | Exceptional 10.7% |
| Thais | 100.0 /100 | #8 | Exceptional 10.8% |
| Taiwanese | 100.0 /100 | #9 | Exceptional 10.9% |
| Immigrants | Fiji | 100.0 /100 | #10 | Exceptional 10.9% |
| Immigrants | Philippines | 100.0 /100 | #11 | Exceptional 10.9% |
| Immigrants | Afghanistan | 100.0 /100 | #12 | Exceptional 10.9% |
| Immigrants | South Central Asia | 100.0 /100 | #13 | Exceptional 10.9% |
| Chinese | 100.0 /100 | #14 | Exceptional 11.0% |
| Koreans | 100.0 /100 | #15 | Exceptional 11.0% |
Demographics Similar to Lithuanians by Single Male Poverty
In terms of single male poverty, the demographic groups most similar to Lithuanians are Immigrants from Norway (13.0%, a difference of 0.020%), Slovene (13.0%, a difference of 0.040%), Trinidadian and Tobagonian (13.0%, a difference of 0.050%), Immigrants from Laos (13.0%, a difference of 0.070%), and Immigrants from Grenada (13.0%, a difference of 0.080%).
| Demographics | Rating | Rank | Single Male Poverty |
| Immigrants | Thailand | 26.6 /100 | #191 | Fair 13.0% |
| Immigrants | Jamaica | 26.5 /100 | #192 | Fair 13.0% |
| Immigrants | South Africa | 26.1 /100 | #193 | Fair 13.0% |
| Liberians | 25.2 /100 | #194 | Fair 13.0% |
| Immigrants | England | 23.4 /100 | #195 | Fair 13.0% |
| Immigrants | Grenada | 23.1 /100 | #196 | Fair 13.0% |
| Immigrants | Laos | 23.1 /100 | #197 | Fair 13.0% |
| Lithuanians | 22.1 /100 | #198 | Fair 13.0% |
| Immigrants | Norway | 21.8 /100 | #199 | Fair 13.0% |
| Slovenes | 21.6 /100 | #200 | Fair 13.0% |
| Trinidadians and Tobagonians | 21.4 /100 | #201 | Fair 13.0% |
| Basques | 20.7 /100 | #202 | Fair 13.0% |
| Immigrants | Bangladesh | 20.4 /100 | #203 | Fair 13.0% |
| Estonians | 20.3 /100 | #204 | Fair 13.0% |
| Poles | 19.3 /100 | #205 | Poor 13.0% |