Zimbabwean vs Bolivian In Labor Force | Age > 16
COMPARE
Zimbabwean
Bolivian
In Labor Force | Age > 16
In Labor Force | Age > 16 Comparison
Zimbabweans
Bolivians
67.3%
IN LABOR FORCE | AGE > 16
100.0/ 100
METRIC RATING
27th/ 347
METRIC RANK
68.2%
IN LABOR FORCE | AGE > 16
100.0/ 100
METRIC RATING
11th/ 347
METRIC RANK
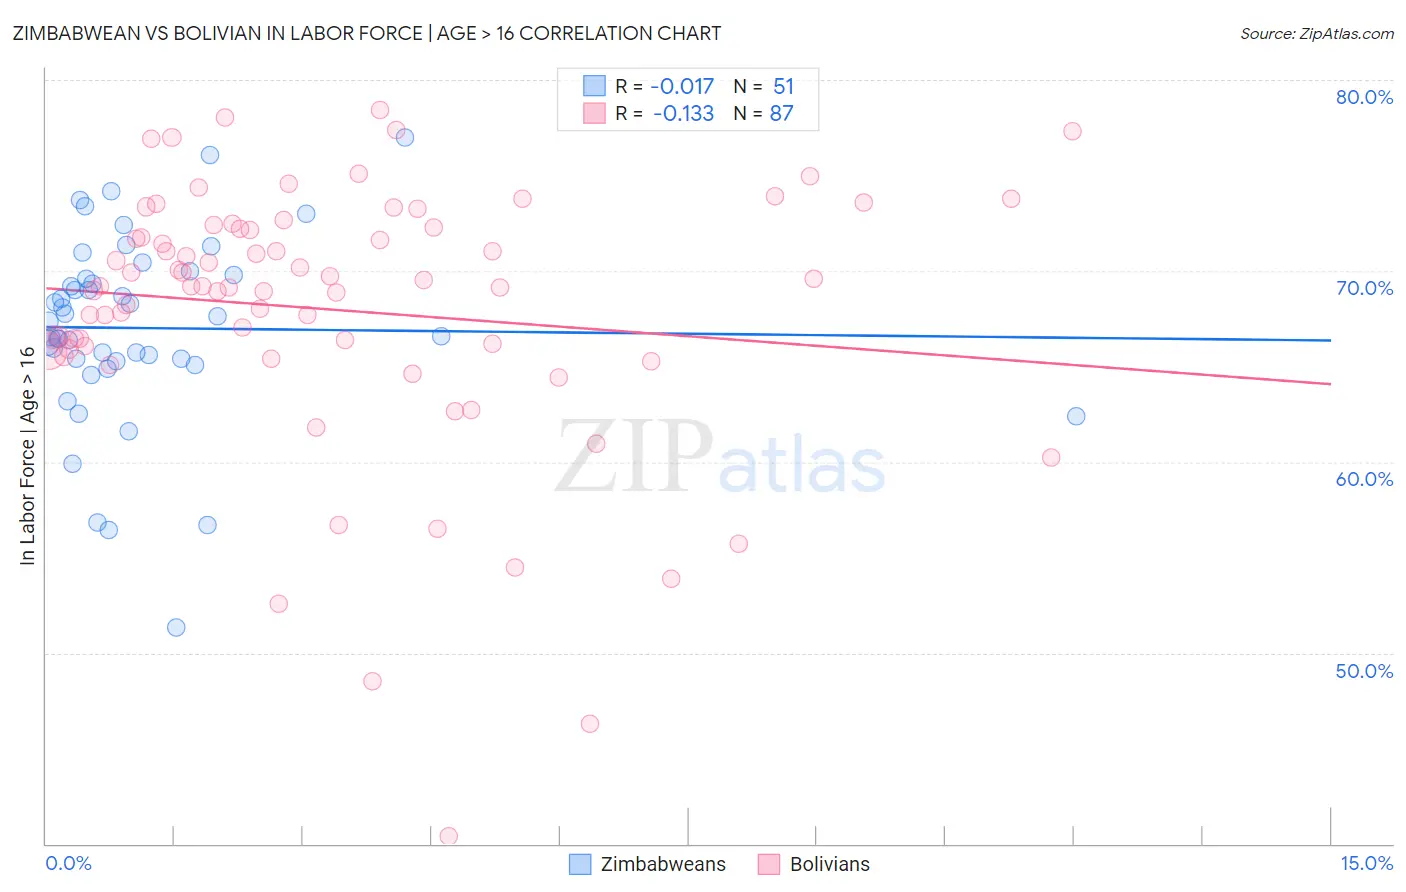
Zimbabwean vs Bolivian In Labor Force | Age > 16 Correlation Chart
The statistical analysis conducted on geographies consisting of 69,208,654 people shows no correlation between the proportion of Zimbabweans and labor force participation rate among population ages 16 and over in the United States with a correlation coefficient (R) of -0.017 and weighted average of 67.3%. Similarly, the statistical analysis conducted on geographies consisting of 184,675,621 people shows a poor negative correlation between the proportion of Bolivians and labor force participation rate among population ages 16 and over in the United States with a correlation coefficient (R) of -0.133 and weighted average of 68.2%, a difference of 1.3%.
In Labor Force | Age > 16 Correlation Summary
| Measurement | Zimbabwean | Bolivian |
| Minimum | 51.3% | 40.4% |
| Maximum | 77.0% | 78.4% |
| Range | 25.7% | 38.0% |
| Mean | 67.0% | 68.0% |
| Median | 67.4% | 69.2% |
| Interquartile 25% (IQ1) | 65.3% | 65.9% |
| Interquartile 75% (IQ3) | 69.8% | 72.3% |
| Interquartile Range (IQR) | 4.5% | 6.4% |
| Standard Deviation (Sample) | 5.0% | 7.0% |
| Standard Deviation (Population) | 4.9% | 6.9% |
Demographics Similar to Zimbabweans and Bolivians by In Labor Force | Age > 16
In terms of in labor force | age > 16, the demographic groups most similar to Zimbabweans are Immigrants from Cabo Verde (67.3%, a difference of 0.080%), Immigrants from Morocco (67.2%, a difference of 0.080%), Immigrants from Africa (67.4%, a difference of 0.11%), Thai (67.2%, a difference of 0.12%), and Ugandan (67.4%, a difference of 0.13%). Similarly, the demographic groups most similar to Bolivians are Sudanese (68.0%, a difference of 0.22%), Immigrants from Nepal (68.0%, a difference of 0.24%), Immigrants from Bolivia (68.4%, a difference of 0.37%), Immigrants from Eastern Africa (68.5%, a difference of 0.40%), and Liberian (67.8%, a difference of 0.60%).
| Demographics | Rating | Rank | In Labor Force | Age > 16 |
| Immigrants | Eastern Africa | 100.0 /100 | #9 | Exceptional 68.5% |
| Immigrants | Bolivia | 100.0 /100 | #10 | Exceptional 68.4% |
| Bolivians | 100.0 /100 | #11 | Exceptional 68.2% |
| Sudanese | 100.0 /100 | #12 | Exceptional 68.0% |
| Immigrants | Nepal | 100.0 /100 | #13 | Exceptional 68.0% |
| Liberians | 100.0 /100 | #14 | Exceptional 67.8% |
| Immigrants | Middle Africa | 100.0 /100 | #15 | Exceptional 67.7% |
| Immigrants | Sudan | 100.0 /100 | #16 | Exceptional 67.7% |
| Immigrants | India | 100.0 /100 | #17 | Exceptional 67.6% |
| Immigrants | Liberia | 100.0 /100 | #18 | Exceptional 67.6% |
| Kenyans | 100.0 /100 | #19 | Exceptional 67.6% |
| Immigrants | Kenya | 100.0 /100 | #20 | Exceptional 67.6% |
| Tongans | 100.0 /100 | #21 | Exceptional 67.5% |
| Immigrants | Uganda | 100.0 /100 | #22 | Exceptional 67.5% |
| Cambodians | 100.0 /100 | #23 | Exceptional 67.4% |
| Ugandans | 100.0 /100 | #24 | Exceptional 67.4% |
| Immigrants | Africa | 100.0 /100 | #25 | Exceptional 67.4% |
| Immigrants | Cabo Verde | 100.0 /100 | #26 | Exceptional 67.3% |
| Zimbabweans | 100.0 /100 | #27 | Exceptional 67.3% |
| Immigrants | Morocco | 100.0 /100 | #28 | Exceptional 67.2% |
| Thais | 100.0 /100 | #29 | Exceptional 67.2% |