Zimbabwean vs Welsh In Labor Force | Age > 16
COMPARE
Zimbabwean
Welsh
In Labor Force | Age > 16
In Labor Force | Age > 16 Comparison
Zimbabweans
Welsh
67.3%
IN LABOR FORCE | AGE > 16
100.0/ 100
METRIC RATING
27th/ 347
METRIC RANK
64.0%
IN LABOR FORCE | AGE > 16
0.2/ 100
METRIC RATING
279th/ 347
METRIC RANK
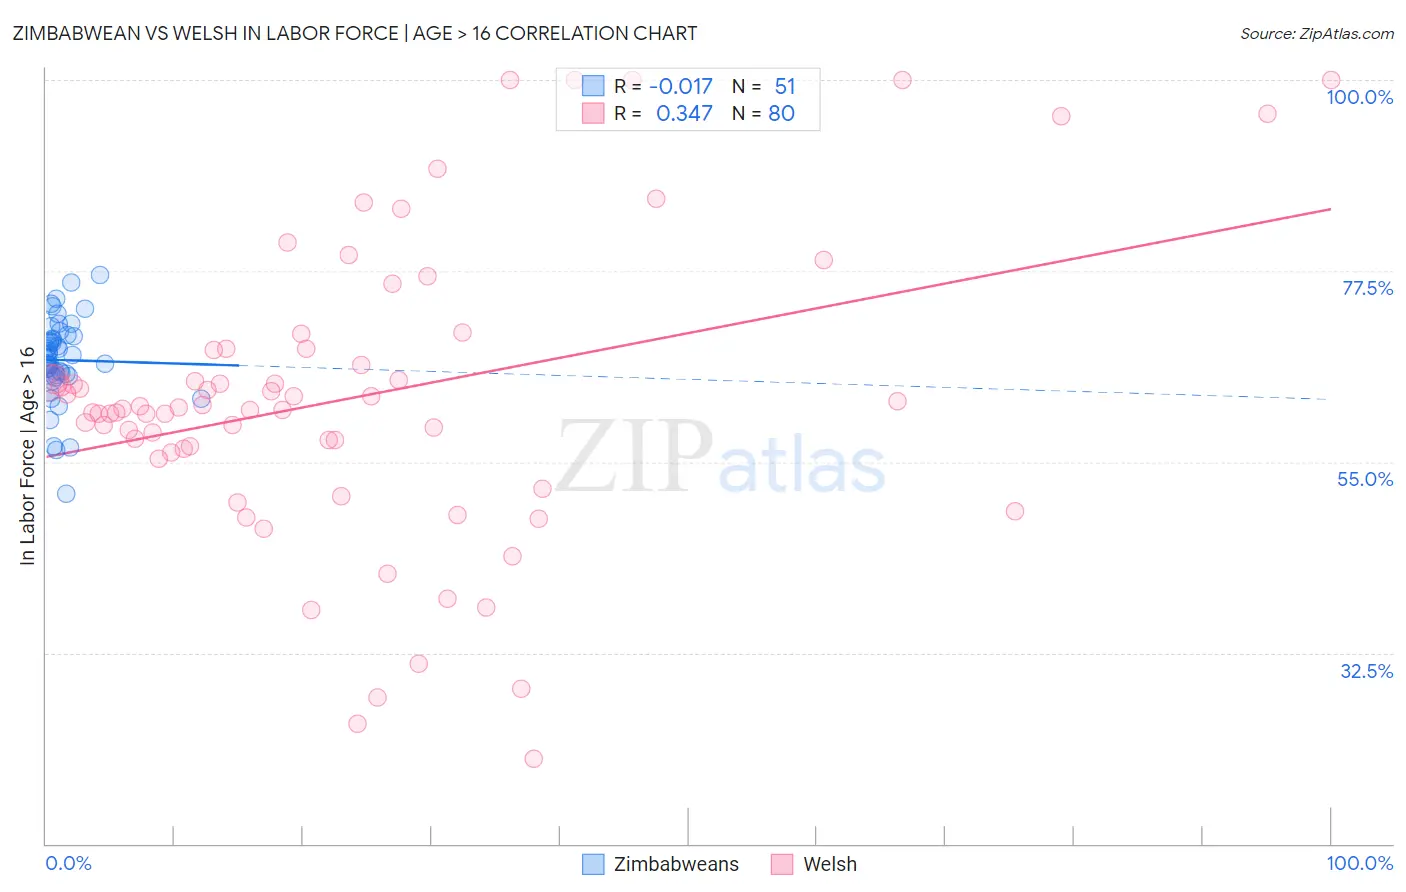
Zimbabwean vs Welsh In Labor Force | Age > 16 Correlation Chart
The statistical analysis conducted on geographies consisting of 69,208,654 people shows no correlation between the proportion of Zimbabweans and labor force participation rate among population ages 16 and over in the United States with a correlation coefficient (R) of -0.017 and weighted average of 67.3%. Similarly, the statistical analysis conducted on geographies consisting of 528,607,710 people shows a mild positive correlation between the proportion of Welsh and labor force participation rate among population ages 16 and over in the United States with a correlation coefficient (R) of 0.347 and weighted average of 64.0%, a difference of 5.1%.
In Labor Force | Age > 16 Correlation Summary
| Measurement | Zimbabwean | Welsh |
| Minimum | 51.3% | 20.0% |
| Maximum | 77.0% | 100.0% |
| Range | 25.7% | 80.0% |
| Mean | 67.0% | 62.6% |
| Median | 67.4% | 61.3% |
| Interquartile 25% (IQ1) | 65.3% | 56.3% |
| Interquartile 75% (IQ3) | 69.8% | 68.3% |
| Interquartile Range (IQR) | 4.5% | 12.0% |
| Standard Deviation (Sample) | 5.0% | 17.5% |
| Standard Deviation (Population) | 4.9% | 17.3% |
Similar Demographics by In Labor Force | Age > 16
Demographics Similar to Zimbabweans by In Labor Force | Age > 16
In terms of in labor force | age > 16, the demographic groups most similar to Zimbabweans are Immigrants from Cabo Verde (67.3%, a difference of 0.080%), Immigrants from Morocco (67.2%, a difference of 0.080%), Immigrants from Africa (67.4%, a difference of 0.11%), Thai (67.2%, a difference of 0.12%), and Immigrants from Zaire (67.2%, a difference of 0.12%).
| Demographics | Rating | Rank | In Labor Force | Age > 16 |
| Immigrants | Kenya | 100.0 /100 | #20 | Exceptional 67.6% |
| Tongans | 100.0 /100 | #21 | Exceptional 67.5% |
| Immigrants | Uganda | 100.0 /100 | #22 | Exceptional 67.5% |
| Cambodians | 100.0 /100 | #23 | Exceptional 67.4% |
| Ugandans | 100.0 /100 | #24 | Exceptional 67.4% |
| Immigrants | Africa | 100.0 /100 | #25 | Exceptional 67.4% |
| Immigrants | Cabo Verde | 100.0 /100 | #26 | Exceptional 67.3% |
| Zimbabweans | 100.0 /100 | #27 | Exceptional 67.3% |
| Immigrants | Morocco | 100.0 /100 | #28 | Exceptional 67.2% |
| Thais | 100.0 /100 | #29 | Exceptional 67.2% |
| Immigrants | Zaire | 100.0 /100 | #30 | Exceptional 67.2% |
| Ghanaians | 100.0 /100 | #31 | Exceptional 67.1% |
| Immigrants | Congo | 100.0 /100 | #32 | Exceptional 67.1% |
| Afghans | 100.0 /100 | #33 | Exceptional 67.1% |
| Immigrants | Ghana | 100.0 /100 | #34 | Exceptional 67.1% |
Demographics Similar to Welsh by In Labor Force | Age > 16
In terms of in labor force | age > 16, the demographic groups most similar to Welsh are Immigrants from St. Vincent and the Grenadines (64.0%, a difference of 0.010%), French Canadian (64.0%, a difference of 0.010%), Assyrian/Chaldean/Syriac (64.0%, a difference of 0.030%), Immigrants from Bahamas (64.0%, a difference of 0.060%), and Immigrants from Cuba (64.1%, a difference of 0.090%).
| Demographics | Rating | Rank | In Labor Force | Age > 16 |
| Native Hawaiians | 0.3 /100 | #272 | Tragic 64.1% |
| Hmong | 0.3 /100 | #273 | Tragic 64.1% |
| Immigrants | Cuba | 0.3 /100 | #274 | Tragic 64.1% |
| Mexicans | 0.3 /100 | #275 | Tragic 64.1% |
| French American Indians | 0.3 /100 | #276 | Tragic 64.1% |
| Immigrants | Bahamas | 0.3 /100 | #277 | Tragic 64.0% |
| Assyrians/Chaldeans/Syriacs | 0.3 /100 | #278 | Tragic 64.0% |
| Welsh | 0.2 /100 | #279 | Tragic 64.0% |
| Immigrants | St. Vincent and the Grenadines | 0.2 /100 | #280 | Tragic 64.0% |
| French Canadians | 0.2 /100 | #281 | Tragic 64.0% |
| Immigrants | Guyana | 0.2 /100 | #282 | Tragic 64.0% |
| Immigrants | Germany | 0.1 /100 | #283 | Tragic 63.9% |
| French | 0.1 /100 | #284 | Tragic 63.9% |
| Slovaks | 0.1 /100 | #285 | Tragic 63.9% |
| Immigrants | Austria | 0.1 /100 | #286 | Tragic 63.9% |