Costa Rican vs Bolivian In Labor Force | Age > 16
COMPARE
Costa Rican
Bolivian
In Labor Force | Age > 16
In Labor Force | Age > 16 Comparison
Costa Ricans
Bolivians
65.6%
IN LABOR FORCE | AGE > 16
93.2/ 100
METRIC RATING
134th/ 347
METRIC RANK
68.2%
IN LABOR FORCE | AGE > 16
100.0/ 100
METRIC RATING
11th/ 347
METRIC RANK
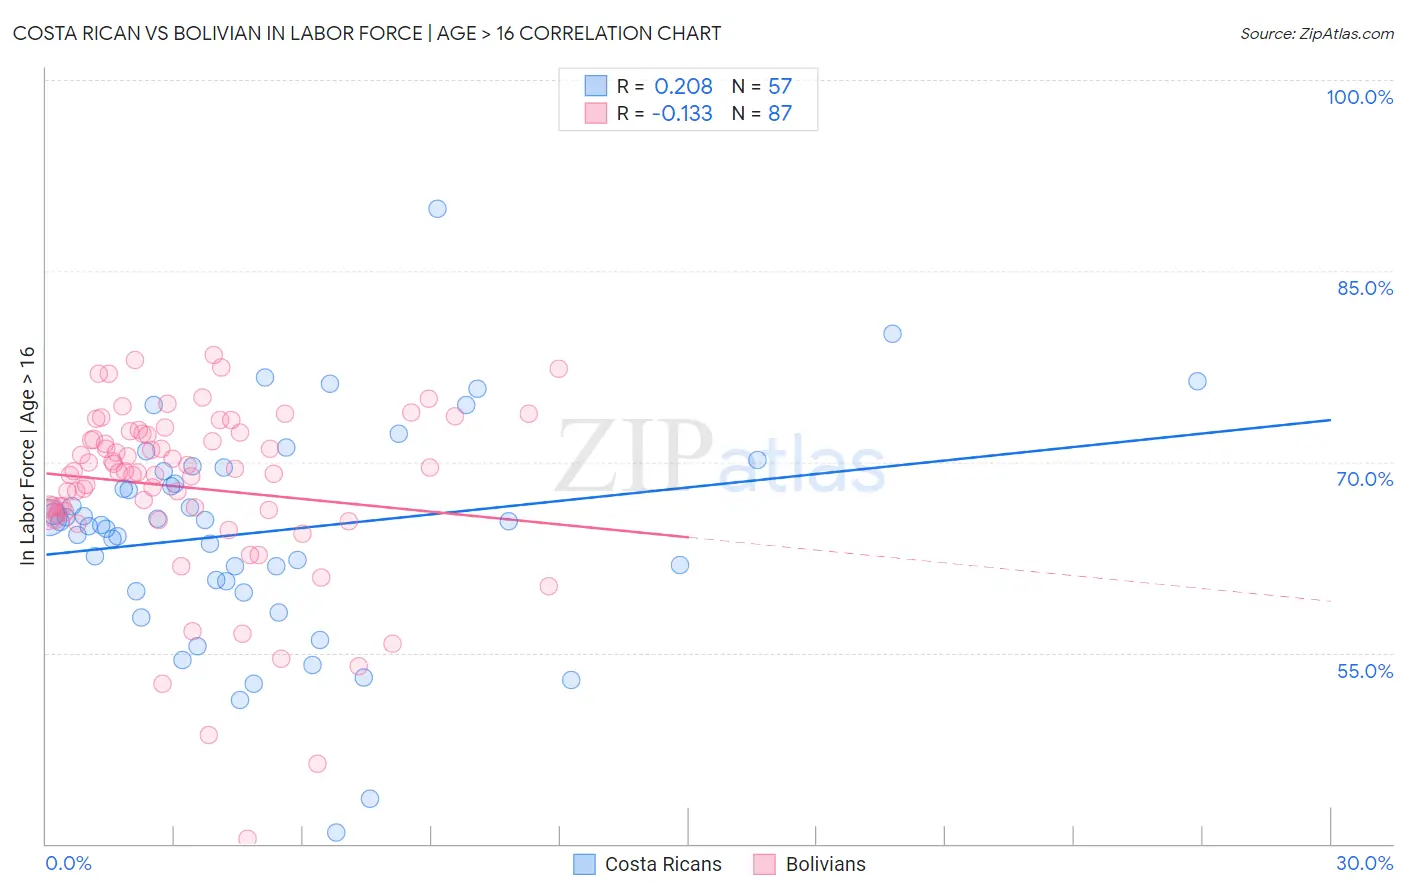
Costa Rican vs Bolivian In Labor Force | Age > 16 Correlation Chart
The statistical analysis conducted on geographies consisting of 253,602,231 people shows a weak positive correlation between the proportion of Costa Ricans and labor force participation rate among population ages 16 and over in the United States with a correlation coefficient (R) of 0.208 and weighted average of 65.6%. Similarly, the statistical analysis conducted on geographies consisting of 184,675,621 people shows a poor negative correlation between the proportion of Bolivians and labor force participation rate among population ages 16 and over in the United States with a correlation coefficient (R) of -0.133 and weighted average of 68.2%, a difference of 4.0%.
In Labor Force | Age > 16 Correlation Summary
| Measurement | Costa Rican | Bolivian |
| Minimum | 40.9% | 40.4% |
| Maximum | 89.9% | 78.4% |
| Range | 49.0% | 38.0% |
| Mean | 64.5% | 68.0% |
| Median | 65.3% | 69.2% |
| Interquartile 25% (IQ1) | 60.2% | 65.9% |
| Interquartile 75% (IQ3) | 69.4% | 72.3% |
| Interquartile Range (IQR) | 9.2% | 6.4% |
| Standard Deviation (Sample) | 8.5% | 7.0% |
| Standard Deviation (Population) | 8.5% | 6.9% |
Similar Demographics by In Labor Force | Age > 16
Demographics Similar to Costa Ricans by In Labor Force | Age > 16
In terms of in labor force | age > 16, the demographic groups most similar to Costa Ricans are Immigrants from Lithuania (65.6%, a difference of 0.010%), Guatemalan (65.6%, a difference of 0.030%), Immigrants from Argentina (65.6%, a difference of 0.030%), Immigrants from North Macedonia (65.6%, a difference of 0.040%), and Guamanian/Chamorro (65.6%, a difference of 0.040%).
| Demographics | Rating | Rank | In Labor Force | Age > 16 |
| Immigrants | Eastern Asia | 94.9 /100 | #127 | Exceptional 65.7% |
| Ecuadorians | 94.7 /100 | #128 | Exceptional 65.6% |
| Immigrants | Philippines | 94.5 /100 | #129 | Exceptional 65.6% |
| Immigrants | Guatemala | 94.4 /100 | #130 | Exceptional 65.6% |
| Icelanders | 94.3 /100 | #131 | Exceptional 65.6% |
| Immigrants | North Macedonia | 94.1 /100 | #132 | Exceptional 65.6% |
| Immigrants | Lithuania | 93.5 /100 | #133 | Exceptional 65.6% |
| Costa Ricans | 93.2 /100 | #134 | Exceptional 65.6% |
| Guatemalans | 92.5 /100 | #135 | Exceptional 65.6% |
| Immigrants | Argentina | 92.4 /100 | #136 | Exceptional 65.6% |
| Guamanians/Chamorros | 92.4 /100 | #137 | Exceptional 65.6% |
| Immigrants | West Indies | 92.0 /100 | #138 | Exceptional 65.6% |
| Immigrants | Taiwan | 90.8 /100 | #139 | Exceptional 65.5% |
| Immigrants | Costa Rica | 90.8 /100 | #140 | Exceptional 65.5% |
| Samoans | 90.5 /100 | #141 | Exceptional 65.5% |
Demographics Similar to Bolivians by In Labor Force | Age > 16
In terms of in labor force | age > 16, the demographic groups most similar to Bolivians are Sudanese (68.0%, a difference of 0.22%), Immigrants from Nepal (68.0%, a difference of 0.24%), Immigrants from Bolivia (68.4%, a difference of 0.37%), Immigrants from Eastern Africa (68.5%, a difference of 0.40%), and Immigrants from Sierra Leone (68.5%, a difference of 0.41%).
| Demographics | Rating | Rank | In Labor Force | Age > 16 |
| Immigrants | Somalia | 100.0 /100 | #4 | Exceptional 69.1% |
| Sierra Leoneans | 100.0 /100 | #5 | Exceptional 68.9% |
| Immigrants | Eritrea | 100.0 /100 | #6 | Exceptional 68.9% |
| Immigrants | Cameroon | 100.0 /100 | #7 | Exceptional 68.7% |
| Immigrants | Sierra Leone | 100.0 /100 | #8 | Exceptional 68.5% |
| Immigrants | Eastern Africa | 100.0 /100 | #9 | Exceptional 68.5% |
| Immigrants | Bolivia | 100.0 /100 | #10 | Exceptional 68.4% |
| Bolivians | 100.0 /100 | #11 | Exceptional 68.2% |
| Sudanese | 100.0 /100 | #12 | Exceptional 68.0% |
| Immigrants | Nepal | 100.0 /100 | #13 | Exceptional 68.0% |
| Liberians | 100.0 /100 | #14 | Exceptional 67.8% |
| Immigrants | Middle Africa | 100.0 /100 | #15 | Exceptional 67.7% |
| Immigrants | Sudan | 100.0 /100 | #16 | Exceptional 67.7% |
| Immigrants | India | 100.0 /100 | #17 | Exceptional 67.6% |
| Immigrants | Liberia | 100.0 /100 | #18 | Exceptional 67.6% |