Zimbabwean vs Immigrants from India In Labor Force | Age > 16
COMPARE
Zimbabwean
Immigrants from India
In Labor Force | Age > 16
In Labor Force | Age > 16 Comparison
Zimbabweans
Immigrants from India
67.3%
IN LABOR FORCE | AGE > 16
100.0/ 100
METRIC RATING
27th/ 347
METRIC RANK
67.6%
IN LABOR FORCE | AGE > 16
100.0/ 100
METRIC RATING
17th/ 347
METRIC RANK
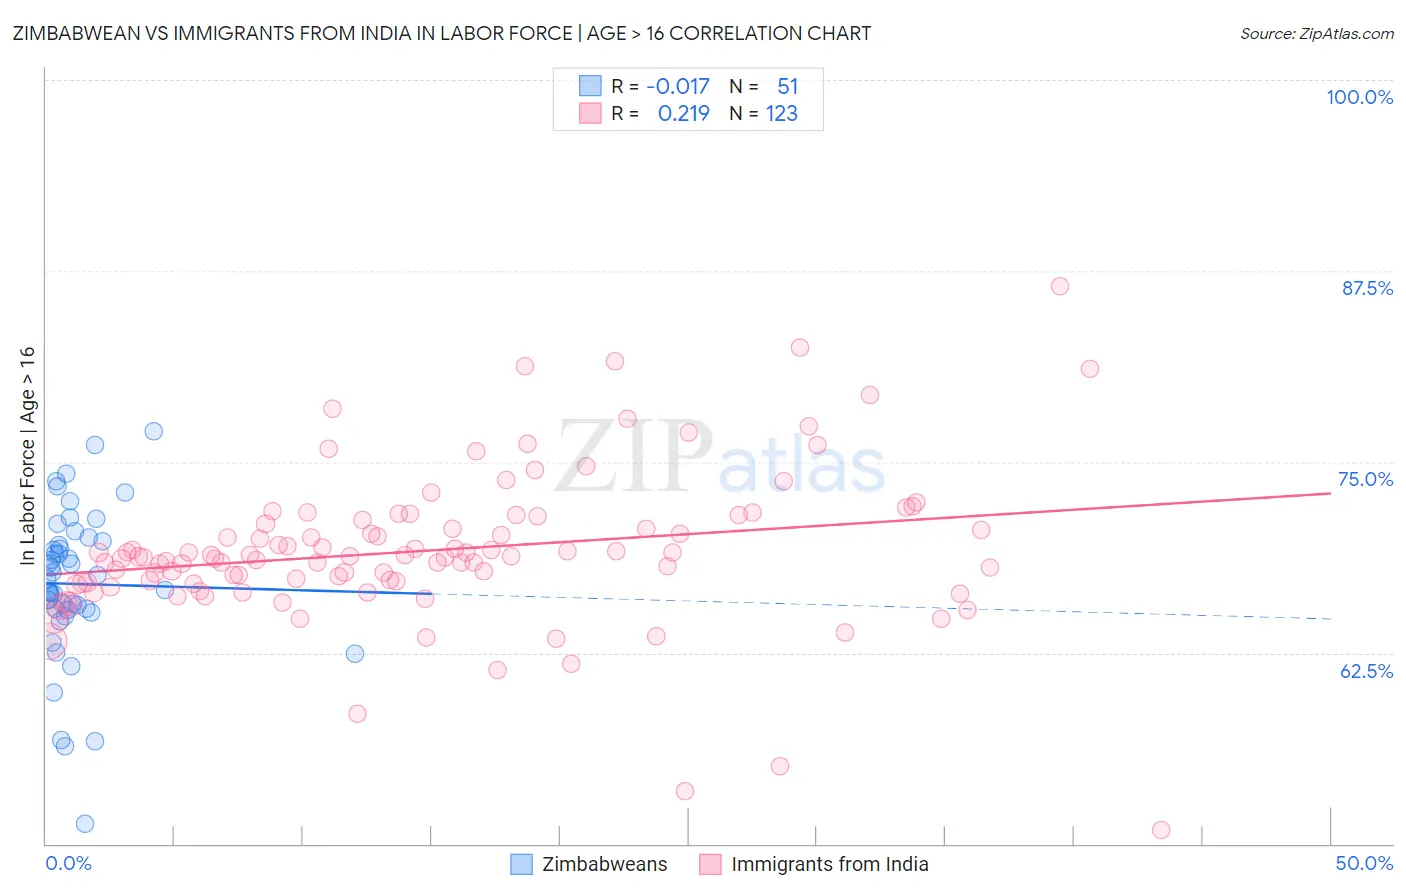
Zimbabwean vs Immigrants from India In Labor Force | Age > 16 Correlation Chart
The statistical analysis conducted on geographies consisting of 69,208,654 people shows no correlation between the proportion of Zimbabweans and labor force participation rate among population ages 16 and over in the United States with a correlation coefficient (R) of -0.017 and weighted average of 67.3%. Similarly, the statistical analysis conducted on geographies consisting of 434,131,731 people shows a weak positive correlation between the proportion of Immigrants from India and labor force participation rate among population ages 16 and over in the United States with a correlation coefficient (R) of 0.219 and weighted average of 67.6%, a difference of 0.49%.
In Labor Force | Age > 16 Correlation Summary
| Measurement | Zimbabwean | Immigrants from India |
| Minimum | 51.3% | 50.9% |
| Maximum | 77.0% | 86.5% |
| Range | 25.7% | 35.6% |
| Mean | 67.0% | 69.2% |
| Median | 67.4% | 68.8% |
| Interquartile 25% (IQ1) | 65.3% | 67.1% |
| Interquartile 75% (IQ3) | 69.8% | 71.2% |
| Interquartile Range (IQR) | 4.5% | 4.1% |
| Standard Deviation (Sample) | 5.0% | 5.1% |
| Standard Deviation (Population) | 4.9% | 5.0% |
Demographics Similar to Zimbabweans and Immigrants from India by In Labor Force | Age > 16
In terms of in labor force | age > 16, the demographic groups most similar to Zimbabweans are Immigrants from Cabo Verde (67.3%, a difference of 0.080%), Immigrants from Morocco (67.2%, a difference of 0.080%), Immigrants from Africa (67.4%, a difference of 0.11%), Thai (67.2%, a difference of 0.12%), and Immigrants from Zaire (67.2%, a difference of 0.12%). Similarly, the demographic groups most similar to Immigrants from India are Immigrants from Liberia (67.6%, a difference of 0.020%), Kenyan (67.6%, a difference of 0.050%), Immigrants from Sudan (67.7%, a difference of 0.070%), Immigrants from Kenya (67.6%, a difference of 0.10%), and Tongan (67.5%, a difference of 0.12%).
| Demographics | Rating | Rank | In Labor Force | Age > 16 |
| Sudanese | 100.0 /100 | #12 | Exceptional 68.0% |
| Immigrants | Nepal | 100.0 /100 | #13 | Exceptional 68.0% |
| Liberians | 100.0 /100 | #14 | Exceptional 67.8% |
| Immigrants | Middle Africa | 100.0 /100 | #15 | Exceptional 67.7% |
| Immigrants | Sudan | 100.0 /100 | #16 | Exceptional 67.7% |
| Immigrants | India | 100.0 /100 | #17 | Exceptional 67.6% |
| Immigrants | Liberia | 100.0 /100 | #18 | Exceptional 67.6% |
| Kenyans | 100.0 /100 | #19 | Exceptional 67.6% |
| Immigrants | Kenya | 100.0 /100 | #20 | Exceptional 67.6% |
| Tongans | 100.0 /100 | #21 | Exceptional 67.5% |
| Immigrants | Uganda | 100.0 /100 | #22 | Exceptional 67.5% |
| Cambodians | 100.0 /100 | #23 | Exceptional 67.4% |
| Ugandans | 100.0 /100 | #24 | Exceptional 67.4% |
| Immigrants | Africa | 100.0 /100 | #25 | Exceptional 67.4% |
| Immigrants | Cabo Verde | 100.0 /100 | #26 | Exceptional 67.3% |
| Zimbabweans | 100.0 /100 | #27 | Exceptional 67.3% |
| Immigrants | Morocco | 100.0 /100 | #28 | Exceptional 67.2% |
| Thais | 100.0 /100 | #29 | Exceptional 67.2% |
| Immigrants | Zaire | 100.0 /100 | #30 | Exceptional 67.2% |
| Ghanaians | 100.0 /100 | #31 | Exceptional 67.1% |
| Immigrants | Congo | 100.0 /100 | #32 | Exceptional 67.1% |