Zimbabwean vs Bolivian Bachelor's Degree
COMPARE
Zimbabwean
Bolivian
Bachelor's Degree
Bachelor's Degree Comparison
Zimbabweans
Bolivians
43.3%
BACHELOR'S DEGREE
99.7/ 100
METRIC RATING
65th/ 347
METRIC RANK
44.6%
BACHELOR'S DEGREE
99.9/ 100
METRIC RATING
47th/ 347
METRIC RANK
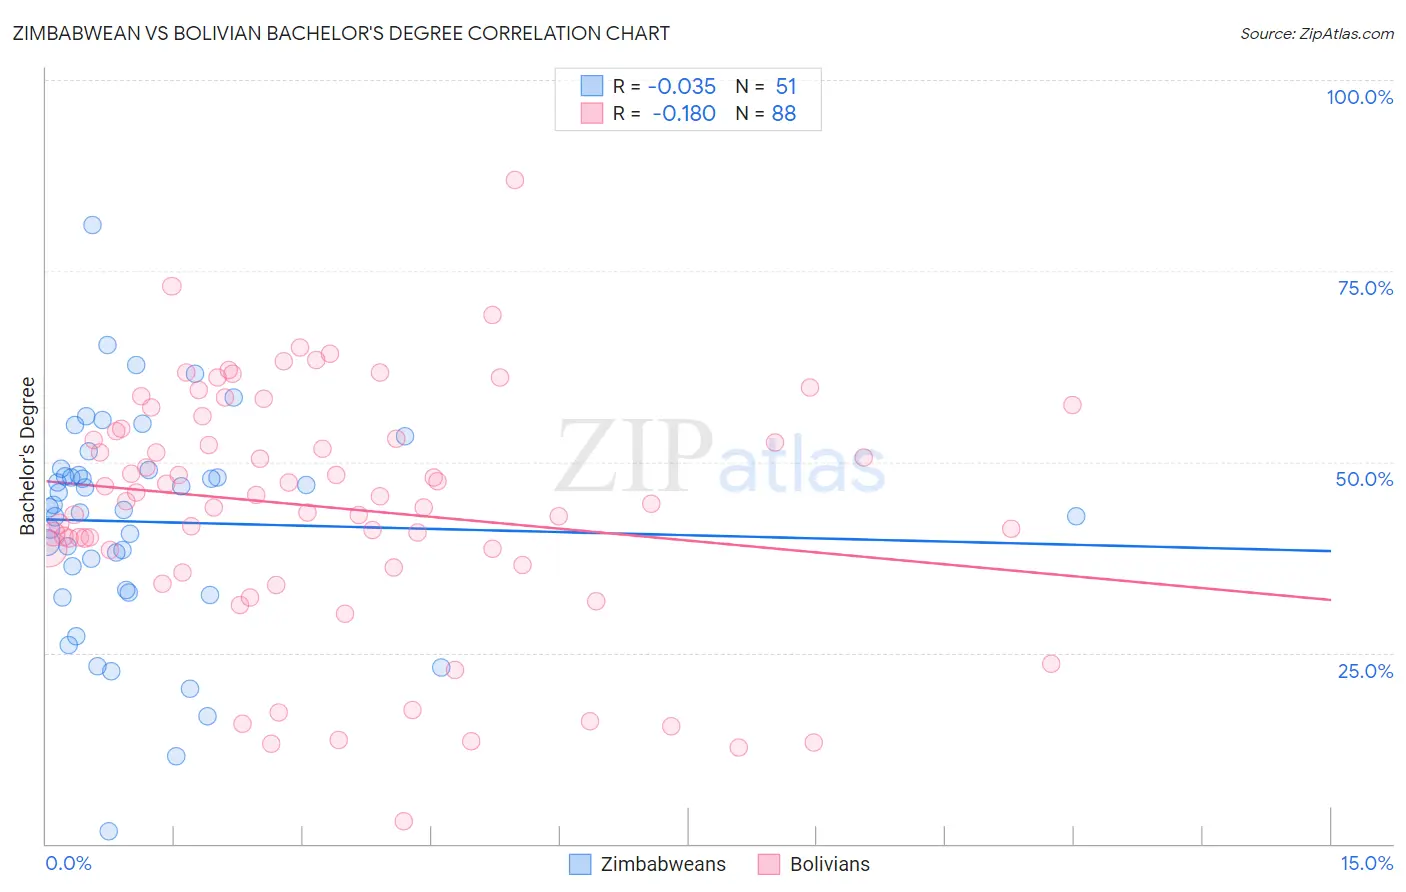
Zimbabwean vs Bolivian Bachelor's Degree Correlation Chart
The statistical analysis conducted on geographies consisting of 69,203,243 people shows no correlation between the proportion of Zimbabweans and percentage of population with at least bachelor's degree education in the United States with a correlation coefficient (R) of -0.035 and weighted average of 43.3%. Similarly, the statistical analysis conducted on geographies consisting of 184,660,995 people shows a poor negative correlation between the proportion of Bolivians and percentage of population with at least bachelor's degree education in the United States with a correlation coefficient (R) of -0.180 and weighted average of 44.6%, a difference of 3.0%.
Bachelor's Degree Correlation Summary
| Measurement | Zimbabwean | Bolivian |
| Minimum | 1.7% | 2.9% |
| Maximum | 81.0% | 86.9% |
| Range | 79.3% | 83.9% |
| Mean | 42.1% | 44.0% |
| Median | 44.0% | 45.2% |
| Interquartile 25% (IQ1) | 33.2% | 37.5% |
| Interquartile 75% (IQ3) | 49.0% | 54.2% |
| Interquartile Range (IQR) | 15.8% | 16.7% |
| Standard Deviation (Sample) | 14.3% | 15.8% |
| Standard Deviation (Population) | 14.1% | 15.7% |
Demographics Similar to Zimbabweans and Bolivians by Bachelor's Degree
In terms of bachelor's degree, the demographic groups most similar to Zimbabweans are Argentinean (43.3%, a difference of 0.0%), Immigrants from Netherlands (43.3%, a difference of 0.020%), Immigrants from Europe (43.4%, a difference of 0.28%), Immigrants from Kazakhstan (43.4%, a difference of 0.32%), and South African (43.6%, a difference of 0.62%). Similarly, the demographic groups most similar to Bolivians are Estonian (44.6%, a difference of 0.0%), Immigrants from Bulgaria (44.6%, a difference of 0.040%), Immigrants from Norway (44.5%, a difference of 0.12%), Immigrants from Greece (44.5%, a difference of 0.24%), and Asian (44.4%, a difference of 0.38%).
| Demographics | Rating | Rank | Bachelor's Degree |
| Immigrants | Bulgaria | 99.9 /100 | #46 | Exceptional 44.6% |
| Bolivians | 99.9 /100 | #47 | Exceptional 44.6% |
| Estonians | 99.9 /100 | #48 | Exceptional 44.6% |
| Immigrants | Norway | 99.9 /100 | #49 | Exceptional 44.5% |
| Immigrants | Greece | 99.9 /100 | #50 | Exceptional 44.5% |
| Asians | 99.9 /100 | #51 | Exceptional 44.4% |
| Immigrants | Spain | 99.9 /100 | #52 | Exceptional 44.3% |
| Immigrants | Asia | 99.9 /100 | #53 | Exceptional 44.3% |
| Immigrants | Austria | 99.9 /100 | #54 | Exceptional 44.2% |
| Immigrants | Bolivia | 99.9 /100 | #55 | Exceptional 44.2% |
| Immigrants | Serbia | 99.9 /100 | #56 | Exceptional 44.1% |
| Paraguayans | 99.9 /100 | #57 | Exceptional 44.0% |
| Immigrants | Czechoslovakia | 99.9 /100 | #58 | Exceptional 44.0% |
| Australians | 99.9 /100 | #59 | Exceptional 44.0% |
| New Zealanders | 99.9 /100 | #60 | Exceptional 44.0% |
| South Africans | 99.8 /100 | #61 | Exceptional 43.6% |
| Immigrants | Kazakhstan | 99.8 /100 | #62 | Exceptional 43.4% |
| Immigrants | Europe | 99.8 /100 | #63 | Exceptional 43.4% |
| Argentineans | 99.7 /100 | #64 | Exceptional 43.3% |
| Zimbabweans | 99.7 /100 | #65 | Exceptional 43.3% |
| Immigrants | Netherlands | 99.7 /100 | #66 | Exceptional 43.3% |