Immigrants from Bahamas vs Bolivian In Labor Force | Age > 16
COMPARE
Immigrants from Bahamas
Bolivian
In Labor Force | Age > 16
In Labor Force | Age > 16 Comparison
Immigrants from Bahamas
Bolivians
64.0%
IN LABOR FORCE | AGE > 16
0.3/ 100
METRIC RATING
277th/ 347
METRIC RANK
68.2%
IN LABOR FORCE | AGE > 16
100.0/ 100
METRIC RATING
11th/ 347
METRIC RANK
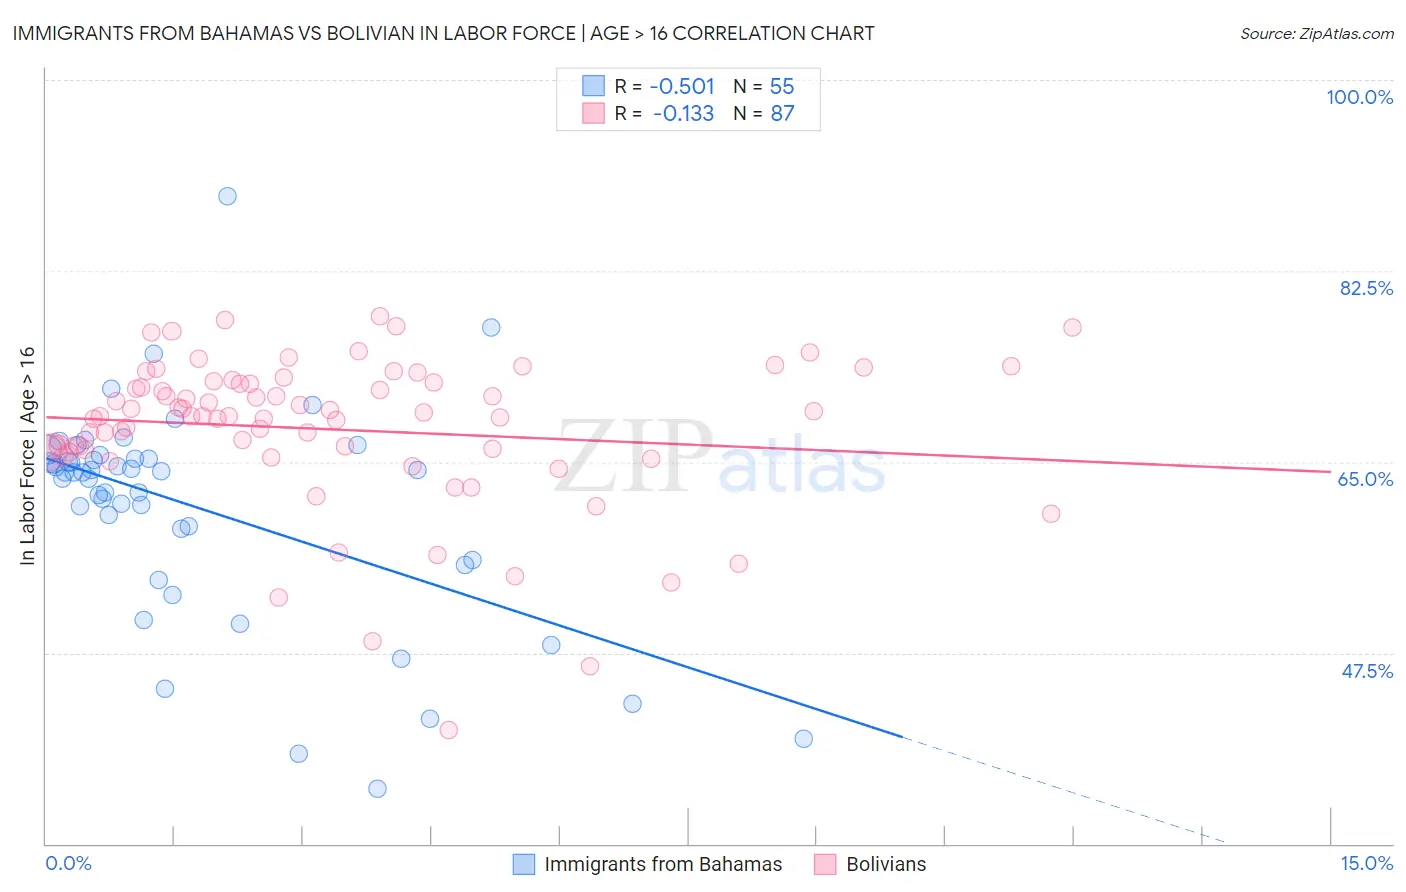
Immigrants from Bahamas vs Bolivian In Labor Force | Age > 16 Correlation Chart
The statistical analysis conducted on geographies consisting of 104,666,072 people shows a substantial negative correlation between the proportion of Immigrants from Bahamas and labor force participation rate among population ages 16 and over in the United States with a correlation coefficient (R) of -0.501 and weighted average of 64.0%. Similarly, the statistical analysis conducted on geographies consisting of 184,675,621 people shows a poor negative correlation between the proportion of Bolivians and labor force participation rate among population ages 16 and over in the United States with a correlation coefficient (R) of -0.133 and weighted average of 68.2%, a difference of 6.5%.
In Labor Force | Age > 16 Correlation Summary
| Measurement | Immigrants from Bahamas | Bolivian |
| Minimum | 35.0% | 40.4% |
| Maximum | 89.3% | 78.4% |
| Range | 54.3% | 38.0% |
| Mean | 60.8% | 68.0% |
| Median | 64.0% | 69.2% |
| Interquartile 25% (IQ1) | 56.0% | 65.9% |
| Interquartile 75% (IQ3) | 65.3% | 72.3% |
| Interquartile Range (IQR) | 9.3% | 6.4% |
| Standard Deviation (Sample) | 10.0% | 7.0% |
| Standard Deviation (Population) | 9.9% | 6.9% |
Similar Demographics by In Labor Force | Age > 16
Demographics Similar to Immigrants from Bahamas by In Labor Force | Age > 16
In terms of in labor force | age > 16, the demographic groups most similar to Immigrants from Bahamas are Assyrian/Chaldean/Syriac (64.0%, a difference of 0.020%), Immigrants from Cuba (64.1%, a difference of 0.030%), Mexican (64.1%, a difference of 0.030%), French American Indian (64.1%, a difference of 0.030%), and Native Hawaiian (64.1%, a difference of 0.050%).
| Demographics | Rating | Rank | In Labor Force | Age > 16 |
| Guyanese | 0.4 /100 | #270 | Tragic 64.1% |
| Dominicans | 0.4 /100 | #271 | Tragic 64.1% |
| Native Hawaiians | 0.3 /100 | #272 | Tragic 64.1% |
| Hmong | 0.3 /100 | #273 | Tragic 64.1% |
| Immigrants | Cuba | 0.3 /100 | #274 | Tragic 64.1% |
| Mexicans | 0.3 /100 | #275 | Tragic 64.1% |
| French American Indians | 0.3 /100 | #276 | Tragic 64.1% |
| Immigrants | Bahamas | 0.3 /100 | #277 | Tragic 64.0% |
| Assyrians/Chaldeans/Syriacs | 0.3 /100 | #278 | Tragic 64.0% |
| Welsh | 0.2 /100 | #279 | Tragic 64.0% |
| Immigrants | St. Vincent and the Grenadines | 0.2 /100 | #280 | Tragic 64.0% |
| French Canadians | 0.2 /100 | #281 | Tragic 64.0% |
| Immigrants | Guyana | 0.2 /100 | #282 | Tragic 64.0% |
| Immigrants | Germany | 0.1 /100 | #283 | Tragic 63.9% |
| French | 0.1 /100 | #284 | Tragic 63.9% |
Demographics Similar to Bolivians by In Labor Force | Age > 16
In terms of in labor force | age > 16, the demographic groups most similar to Bolivians are Sudanese (68.0%, a difference of 0.22%), Immigrants from Nepal (68.0%, a difference of 0.24%), Immigrants from Bolivia (68.4%, a difference of 0.37%), Immigrants from Eastern Africa (68.5%, a difference of 0.40%), and Immigrants from Sierra Leone (68.5%, a difference of 0.41%).
| Demographics | Rating | Rank | In Labor Force | Age > 16 |
| Immigrants | Somalia | 100.0 /100 | #4 | Exceptional 69.1% |
| Sierra Leoneans | 100.0 /100 | #5 | Exceptional 68.9% |
| Immigrants | Eritrea | 100.0 /100 | #6 | Exceptional 68.9% |
| Immigrants | Cameroon | 100.0 /100 | #7 | Exceptional 68.7% |
| Immigrants | Sierra Leone | 100.0 /100 | #8 | Exceptional 68.5% |
| Immigrants | Eastern Africa | 100.0 /100 | #9 | Exceptional 68.5% |
| Immigrants | Bolivia | 100.0 /100 | #10 | Exceptional 68.4% |
| Bolivians | 100.0 /100 | #11 | Exceptional 68.2% |
| Sudanese | 100.0 /100 | #12 | Exceptional 68.0% |
| Immigrants | Nepal | 100.0 /100 | #13 | Exceptional 68.0% |
| Liberians | 100.0 /100 | #14 | Exceptional 67.8% |
| Immigrants | Middle Africa | 100.0 /100 | #15 | Exceptional 67.7% |
| Immigrants | Sudan | 100.0 /100 | #16 | Exceptional 67.7% |
| Immigrants | India | 100.0 /100 | #17 | Exceptional 67.6% |
| Immigrants | Liberia | 100.0 /100 | #18 | Exceptional 67.6% |