Bahamian vs Bolivian In Labor Force | Age > 16
COMPARE
Bahamian
Bolivian
In Labor Force | Age > 16
In Labor Force | Age > 16 Comparison
Bahamians
Bolivians
64.2%
IN LABOR FORCE | AGE > 16
0.6/ 100
METRIC RATING
263rd/ 347
METRIC RANK
68.2%
IN LABOR FORCE | AGE > 16
100.0/ 100
METRIC RATING
11th/ 347
METRIC RANK
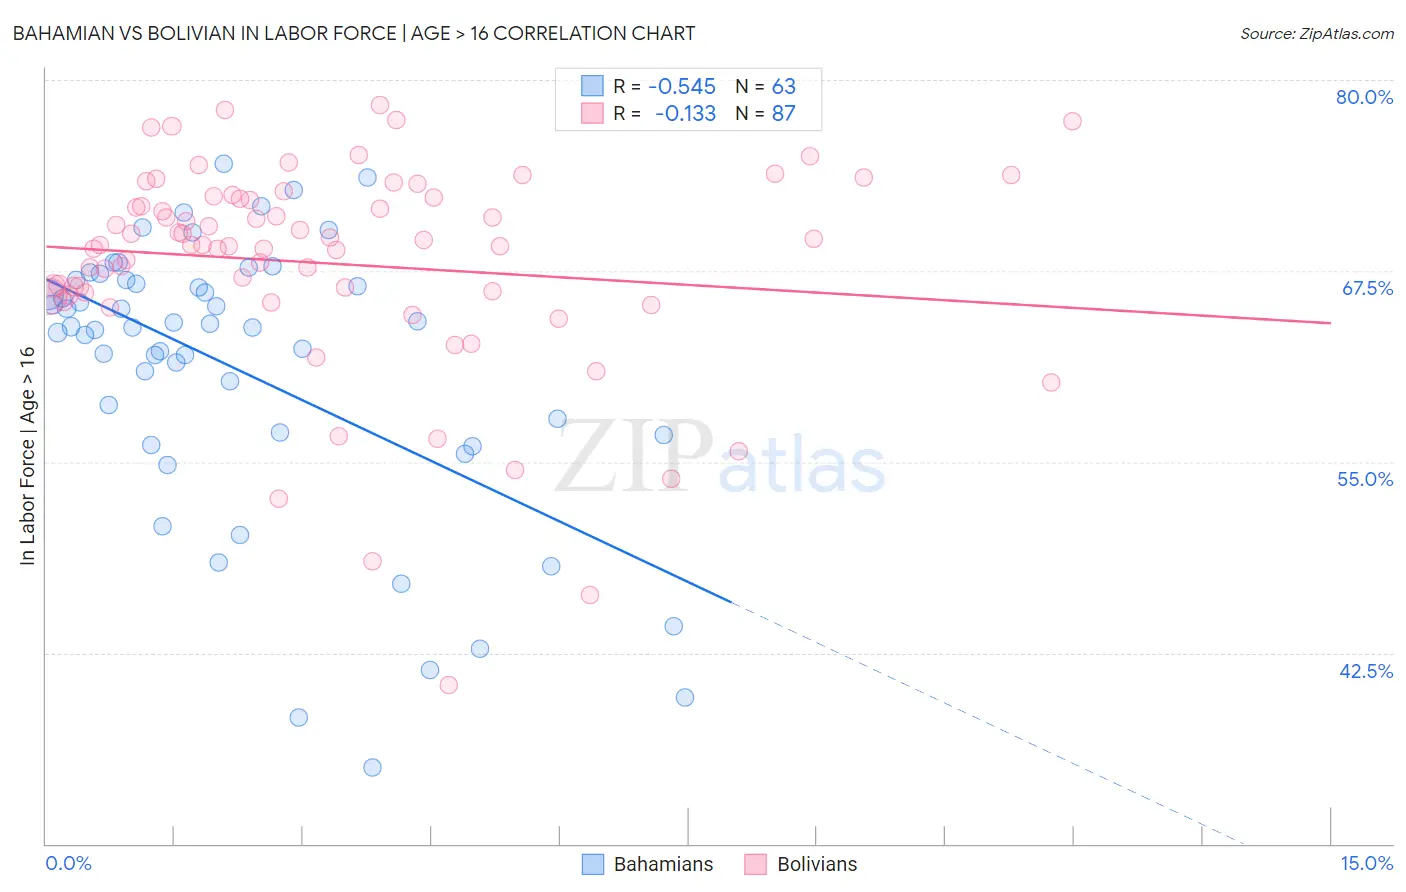
Bahamian vs Bolivian In Labor Force | Age > 16 Correlation Chart
The statistical analysis conducted on geographies consisting of 112,706,440 people shows a substantial negative correlation between the proportion of Bahamians and labor force participation rate among population ages 16 and over in the United States with a correlation coefficient (R) of -0.545 and weighted average of 64.2%. Similarly, the statistical analysis conducted on geographies consisting of 184,675,621 people shows a poor negative correlation between the proportion of Bolivians and labor force participation rate among population ages 16 and over in the United States with a correlation coefficient (R) of -0.133 and weighted average of 68.2%, a difference of 6.2%.
In Labor Force | Age > 16 Correlation Summary
| Measurement | Bahamian | Bolivian |
| Minimum | 35.0% | 40.4% |
| Maximum | 74.5% | 78.4% |
| Range | 39.5% | 38.0% |
| Mean | 61.0% | 68.0% |
| Median | 63.8% | 69.2% |
| Interquartile 25% (IQ1) | 56.8% | 65.9% |
| Interquartile 75% (IQ3) | 66.9% | 72.3% |
| Interquartile Range (IQR) | 10.1% | 6.4% |
| Standard Deviation (Sample) | 9.1% | 7.0% |
| Standard Deviation (Population) | 9.1% | 6.9% |
Similar Demographics by In Labor Force | Age > 16
Demographics Similar to Bahamians by In Labor Force | Age > 16
In terms of in labor force | age > 16, the demographic groups most similar to Bahamians are Finnish (64.2%, a difference of 0.010%), Dutch (64.2%, a difference of 0.020%), Marshallese (64.2%, a difference of 0.030%), Basque (64.2%, a difference of 0.030%), and Immigrants from Western Europe (64.2%, a difference of 0.040%).
| Demographics | Rating | Rank | In Labor Force | Age > 16 |
| Immigrants | Mexico | 1.0 /100 | #256 | Tragic 64.3% |
| Inupiat | 0.8 /100 | #257 | Tragic 64.3% |
| Immigrants | Scotland | 0.8 /100 | #258 | Tragic 64.2% |
| Immigrants | Western Europe | 0.7 /100 | #259 | Tragic 64.2% |
| Marshallese | 0.7 /100 | #260 | Tragic 64.2% |
| Basques | 0.7 /100 | #261 | Tragic 64.2% |
| Finns | 0.7 /100 | #262 | Tragic 64.2% |
| Bahamians | 0.6 /100 | #263 | Tragic 64.2% |
| Dutch | 0.6 /100 | #264 | Tragic 64.2% |
| Cubans | 0.5 /100 | #265 | Tragic 64.2% |
| Immigrants | England | 0.5 /100 | #266 | Tragic 64.2% |
| Canadians | 0.5 /100 | #267 | Tragic 64.1% |
| Spaniards | 0.5 /100 | #268 | Tragic 64.1% |
| Irish | 0.4 /100 | #269 | Tragic 64.1% |
| Guyanese | 0.4 /100 | #270 | Tragic 64.1% |
Demographics Similar to Bolivians by In Labor Force | Age > 16
In terms of in labor force | age > 16, the demographic groups most similar to Bolivians are Sudanese (68.0%, a difference of 0.22%), Immigrants from Nepal (68.0%, a difference of 0.24%), Immigrants from Bolivia (68.4%, a difference of 0.37%), Immigrants from Eastern Africa (68.5%, a difference of 0.40%), and Immigrants from Sierra Leone (68.5%, a difference of 0.41%).
| Demographics | Rating | Rank | In Labor Force | Age > 16 |
| Immigrants | Somalia | 100.0 /100 | #4 | Exceptional 69.1% |
| Sierra Leoneans | 100.0 /100 | #5 | Exceptional 68.9% |
| Immigrants | Eritrea | 100.0 /100 | #6 | Exceptional 68.9% |
| Immigrants | Cameroon | 100.0 /100 | #7 | Exceptional 68.7% |
| Immigrants | Sierra Leone | 100.0 /100 | #8 | Exceptional 68.5% |
| Immigrants | Eastern Africa | 100.0 /100 | #9 | Exceptional 68.5% |
| Immigrants | Bolivia | 100.0 /100 | #10 | Exceptional 68.4% |
| Bolivians | 100.0 /100 | #11 | Exceptional 68.2% |
| Sudanese | 100.0 /100 | #12 | Exceptional 68.0% |
| Immigrants | Nepal | 100.0 /100 | #13 | Exceptional 68.0% |
| Liberians | 100.0 /100 | #14 | Exceptional 67.8% |
| Immigrants | Middle Africa | 100.0 /100 | #15 | Exceptional 67.7% |
| Immigrants | Sudan | 100.0 /100 | #16 | Exceptional 67.7% |
| Immigrants | India | 100.0 /100 | #17 | Exceptional 67.6% |
| Immigrants | Liberia | 100.0 /100 | #18 | Exceptional 67.6% |