Zimbabwean vs Scotch-Irish In Labor Force | Age > 16
COMPARE
Zimbabwean
Scotch-Irish
In Labor Force | Age > 16
In Labor Force | Age > 16 Comparison
Zimbabweans
Scotch-Irish
67.3%
IN LABOR FORCE | AGE > 16
100.0/ 100
METRIC RATING
27th/ 347
METRIC RANK
63.3%
IN LABOR FORCE | AGE > 16
0.0/ 100
METRIC RATING
309th/ 347
METRIC RANK
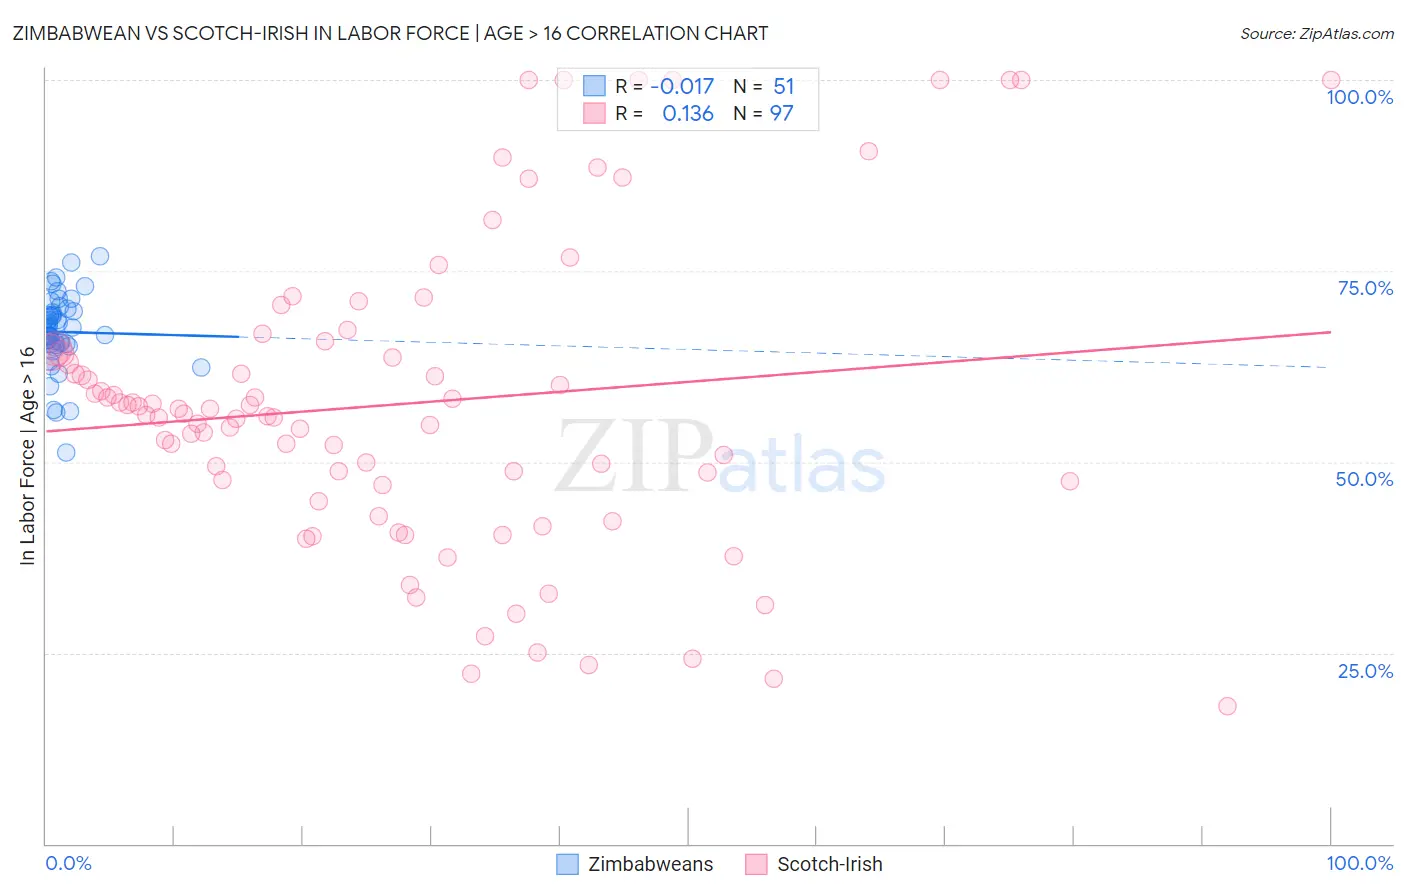
Zimbabwean vs Scotch-Irish In Labor Force | Age > 16 Correlation Chart
The statistical analysis conducted on geographies consisting of 69,208,654 people shows no correlation between the proportion of Zimbabweans and labor force participation rate among population ages 16 and over in the United States with a correlation coefficient (R) of -0.017 and weighted average of 67.3%. Similarly, the statistical analysis conducted on geographies consisting of 548,771,669 people shows a poor positive correlation between the proportion of Scotch-Irish and labor force participation rate among population ages 16 and over in the United States with a correlation coefficient (R) of 0.136 and weighted average of 63.3%, a difference of 6.3%.
In Labor Force | Age > 16 Correlation Summary
| Measurement | Zimbabwean | Scotch-Irish |
| Minimum | 51.3% | 18.0% |
| Maximum | 77.0% | 100.0% |
| Range | 25.7% | 82.0% |
| Mean | 67.0% | 57.6% |
| Median | 67.4% | 56.2% |
| Interquartile 25% (IQ1) | 65.3% | 47.2% |
| Interquartile 75% (IQ3) | 69.8% | 64.5% |
| Interquartile Range (IQR) | 4.5% | 17.3% |
| Standard Deviation (Sample) | 5.0% | 19.8% |
| Standard Deviation (Population) | 4.9% | 19.7% |
Similar Demographics by In Labor Force | Age > 16
Demographics Similar to Zimbabweans by In Labor Force | Age > 16
In terms of in labor force | age > 16, the demographic groups most similar to Zimbabweans are Immigrants from Cabo Verde (67.3%, a difference of 0.080%), Immigrants from Morocco (67.2%, a difference of 0.080%), Immigrants from Africa (67.4%, a difference of 0.11%), Thai (67.2%, a difference of 0.12%), and Immigrants from Zaire (67.2%, a difference of 0.12%).
| Demographics | Rating | Rank | In Labor Force | Age > 16 |
| Immigrants | Kenya | 100.0 /100 | #20 | Exceptional 67.6% |
| Tongans | 100.0 /100 | #21 | Exceptional 67.5% |
| Immigrants | Uganda | 100.0 /100 | #22 | Exceptional 67.5% |
| Cambodians | 100.0 /100 | #23 | Exceptional 67.4% |
| Ugandans | 100.0 /100 | #24 | Exceptional 67.4% |
| Immigrants | Africa | 100.0 /100 | #25 | Exceptional 67.4% |
| Immigrants | Cabo Verde | 100.0 /100 | #26 | Exceptional 67.3% |
| Zimbabweans | 100.0 /100 | #27 | Exceptional 67.3% |
| Immigrants | Morocco | 100.0 /100 | #28 | Exceptional 67.2% |
| Thais | 100.0 /100 | #29 | Exceptional 67.2% |
| Immigrants | Zaire | 100.0 /100 | #30 | Exceptional 67.2% |
| Ghanaians | 100.0 /100 | #31 | Exceptional 67.1% |
| Immigrants | Congo | 100.0 /100 | #32 | Exceptional 67.1% |
| Afghans | 100.0 /100 | #33 | Exceptional 67.1% |
| Immigrants | Ghana | 100.0 /100 | #34 | Exceptional 67.1% |
Demographics Similar to Scotch-Irish by In Labor Force | Age > 16
In terms of in labor force | age > 16, the demographic groups most similar to Scotch-Irish are Shoshone (63.2%, a difference of 0.070%), Blackfeet (63.2%, a difference of 0.080%), Pennsylvania German (63.4%, a difference of 0.13%), Iroquois (63.2%, a difference of 0.14%), and Central American Indian (63.4%, a difference of 0.17%).
| Demographics | Rating | Rank | In Labor Force | Age > 16 |
| Delaware | 0.0 /100 | #302 | Tragic 63.6% |
| Cree | 0.0 /100 | #303 | Tragic 63.5% |
| Immigrants | Nonimmigrants | 0.0 /100 | #304 | Tragic 63.5% |
| Osage | 0.0 /100 | #305 | Tragic 63.5% |
| Blacks/African Americans | 0.0 /100 | #306 | Tragic 63.4% |
| Central American Indians | 0.0 /100 | #307 | Tragic 63.4% |
| Pennsylvania Germans | 0.0 /100 | #308 | Tragic 63.4% |
| Scotch-Irish | 0.0 /100 | #309 | Tragic 63.3% |
| Shoshone | 0.0 /100 | #310 | Tragic 63.2% |
| Blackfeet | 0.0 /100 | #311 | Tragic 63.2% |
| Iroquois | 0.0 /100 | #312 | Tragic 63.2% |
| Chippewa | 0.0 /100 | #313 | Tragic 63.1% |
| Yaqui | 0.0 /100 | #314 | Tragic 63.0% |
| Potawatomi | 0.0 /100 | #315 | Tragic 62.8% |
| Yup'ik | 0.0 /100 | #316 | Tragic 62.7% |