Yugoslavian vs Immigrants from Philippines In Labor Force | Age > 16
COMPARE
Yugoslavian
Immigrants from Philippines
In Labor Force | Age > 16
In Labor Force | Age > 16 Comparison
Yugoslavians
Immigrants from Philippines
65.4%
IN LABOR FORCE | AGE > 16
81.3/ 100
METRIC RATING
152nd/ 347
METRIC RANK
65.6%
IN LABOR FORCE | AGE > 16
94.5/ 100
METRIC RATING
129th/ 347
METRIC RANK
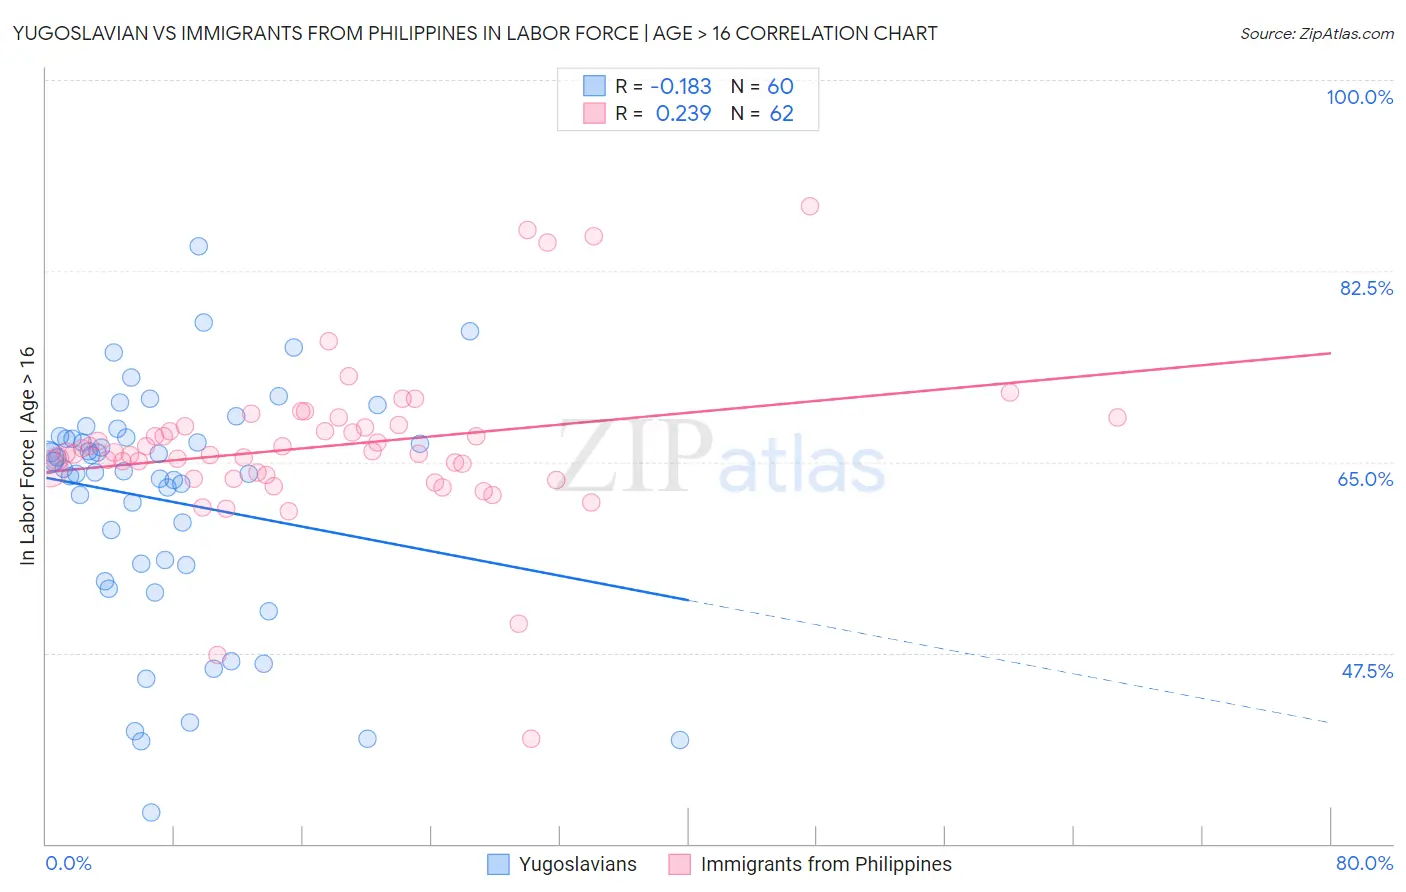
Yugoslavian vs Immigrants from Philippines In Labor Force | Age > 16 Correlation Chart
The statistical analysis conducted on geographies consisting of 285,722,501 people shows a poor negative correlation between the proportion of Yugoslavians and labor force participation rate among population ages 16 and over in the United States with a correlation coefficient (R) of -0.183 and weighted average of 65.4%. Similarly, the statistical analysis conducted on geographies consisting of 471,291,976 people shows a weak positive correlation between the proportion of Immigrants from Philippines and labor force participation rate among population ages 16 and over in the United States with a correlation coefficient (R) of 0.239 and weighted average of 65.6%, a difference of 0.38%.
In Labor Force | Age > 16 Correlation Summary
| Measurement | Yugoslavian | Immigrants from Philippines |
| Minimum | 32.9% | 39.6% |
| Maximum | 84.8% | 88.4% |
| Range | 51.9% | 48.8% |
| Mean | 61.4% | 66.5% |
| Median | 64.3% | 65.8% |
| Interquartile 25% (IQ1) | 55.6% | 63.8% |
| Interquartile 75% (IQ3) | 67.2% | 68.3% |
| Interquartile Range (IQR) | 11.6% | 4.5% |
| Standard Deviation (Sample) | 10.9% | 7.5% |
| Standard Deviation (Population) | 10.8% | 7.5% |
Similar Demographics by In Labor Force | Age > 16
Demographics Similar to Yugoslavians by In Labor Force | Age > 16
In terms of in labor force | age > 16, the demographic groups most similar to Yugoslavians are Czech (65.4%, a difference of 0.0%), Immigrants (65.4%, a difference of 0.010%), Immigrants from China (65.4%, a difference of 0.010%), Immigrants from Eastern Europe (65.4%, a difference of 0.050%), and Immigrants from Armenia (65.3%, a difference of 0.080%).
| Demographics | Rating | Rank | In Labor Force | Age > 16 |
| Tlingit-Haida | 88.3 /100 | #145 | Excellent 65.5% |
| Cypriots | 88.2 /100 | #146 | Excellent 65.5% |
| Immigrants | Oceania | 87.5 /100 | #147 | Excellent 65.5% |
| Bhutanese | 86.3 /100 | #148 | Excellent 65.5% |
| Immigrants | Albania | 85.7 /100 | #149 | Excellent 65.4% |
| Immigrants | Immigrants | 81.9 /100 | #150 | Excellent 65.4% |
| Czechs | 81.5 /100 | #151 | Excellent 65.4% |
| Yugoslavians | 81.3 /100 | #152 | Excellent 65.4% |
| Immigrants | China | 80.5 /100 | #153 | Excellent 65.4% |
| Immigrants | Eastern Europe | 78.3 /100 | #154 | Good 65.4% |
| Immigrants | Armenia | 76.6 /100 | #155 | Good 65.3% |
| Immigrants | Ireland | 75.9 /100 | #156 | Good 65.3% |
| Immigrants | Russia | 75.7 /100 | #157 | Good 65.3% |
| Panamanians | 75.2 /100 | #158 | Good 65.3% |
| Immigrants | Syria | 74.6 /100 | #159 | Good 65.3% |
Demographics Similar to Immigrants from Philippines by In Labor Force | Age > 16
In terms of in labor force | age > 16, the demographic groups most similar to Immigrants from Philippines are Immigrants from Guatemala (65.6%, a difference of 0.0%), Ecuadorian (65.6%, a difference of 0.010%), Icelander (65.6%, a difference of 0.010%), Immigrants from Eastern Asia (65.7%, a difference of 0.020%), and Immigrants from North Macedonia (65.6%, a difference of 0.020%).
| Demographics | Rating | Rank | In Labor Force | Age > 16 |
| Immigrants | Ecuador | 95.9 /100 | #122 | Exceptional 65.7% |
| Immigrants | Iraq | 95.5 /100 | #123 | Exceptional 65.7% |
| Iraqis | 95.4 /100 | #124 | Exceptional 65.7% |
| Norwegians | 95.3 /100 | #125 | Exceptional 65.7% |
| Koreans | 95.3 /100 | #126 | Exceptional 65.7% |
| Immigrants | Eastern Asia | 94.9 /100 | #127 | Exceptional 65.7% |
| Ecuadorians | 94.7 /100 | #128 | Exceptional 65.6% |
| Immigrants | Philippines | 94.5 /100 | #129 | Exceptional 65.6% |
| Immigrants | Guatemala | 94.4 /100 | #130 | Exceptional 65.6% |
| Icelanders | 94.3 /100 | #131 | Exceptional 65.6% |
| Immigrants | North Macedonia | 94.1 /100 | #132 | Exceptional 65.6% |
| Immigrants | Lithuania | 93.5 /100 | #133 | Exceptional 65.6% |
| Costa Ricans | 93.2 /100 | #134 | Exceptional 65.6% |
| Guatemalans | 92.5 /100 | #135 | Exceptional 65.6% |
| Immigrants | Argentina | 92.4 /100 | #136 | Exceptional 65.6% |