Egyptian vs Immigrants from Philippines In Labor Force | Age > 16
COMPARE
Egyptian
Immigrants from Philippines
In Labor Force | Age > 16
In Labor Force | Age > 16 Comparison
Egyptians
Immigrants from Philippines
66.2%
IN LABOR FORCE | AGE > 16
99.8/ 100
METRIC RATING
67th/ 347
METRIC RANK
65.6%
IN LABOR FORCE | AGE > 16
94.5/ 100
METRIC RATING
129th/ 347
METRIC RANK
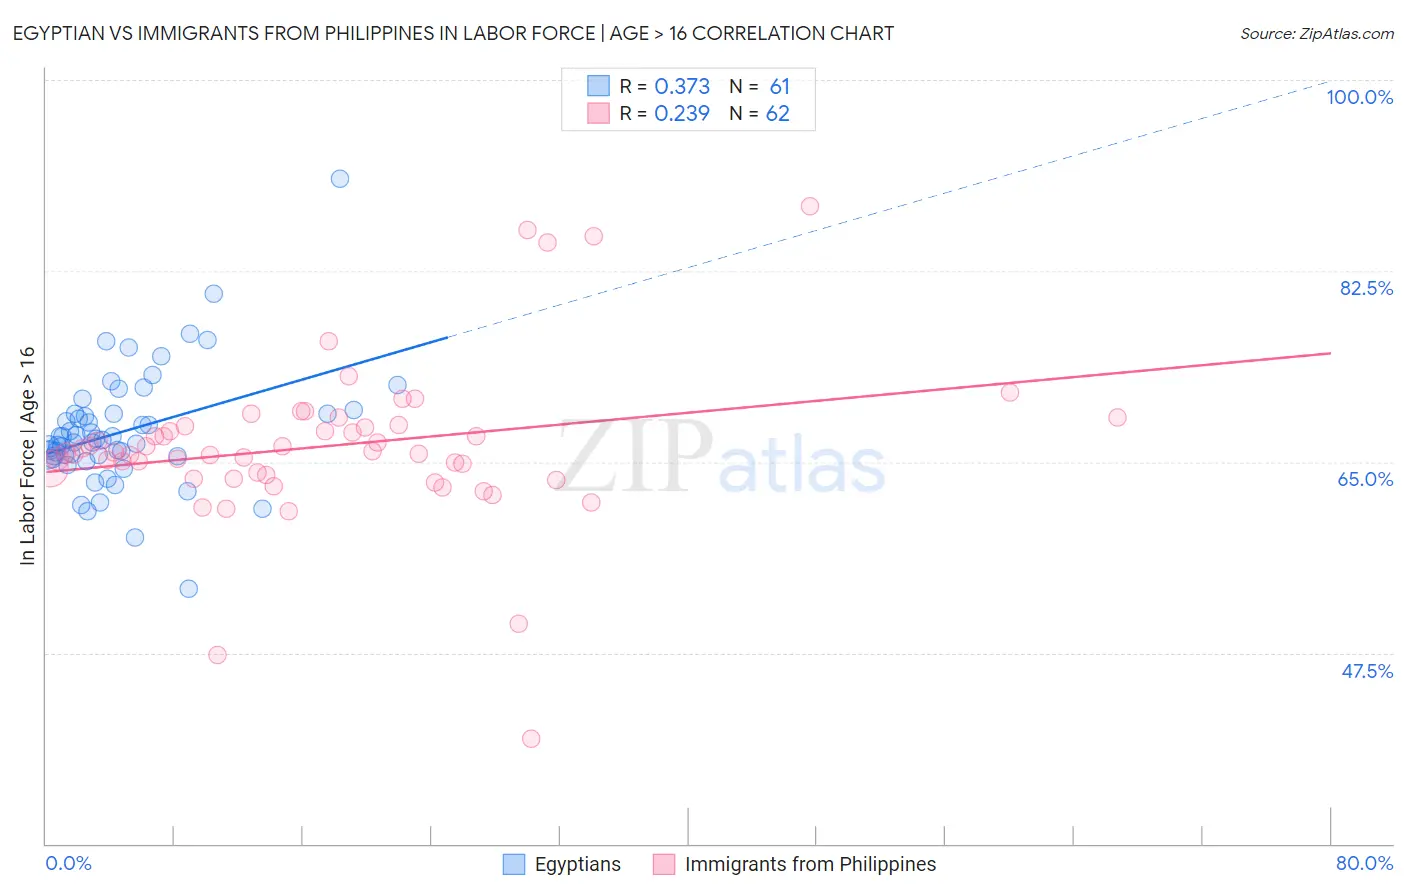
Egyptian vs Immigrants from Philippines In Labor Force | Age > 16 Correlation Chart
The statistical analysis conducted on geographies consisting of 276,931,154 people shows a mild positive correlation between the proportion of Egyptians and labor force participation rate among population ages 16 and over in the United States with a correlation coefficient (R) of 0.373 and weighted average of 66.2%. Similarly, the statistical analysis conducted on geographies consisting of 471,291,976 people shows a weak positive correlation between the proportion of Immigrants from Philippines and labor force participation rate among population ages 16 and over in the United States with a correlation coefficient (R) of 0.239 and weighted average of 65.6%, a difference of 0.92%.
In Labor Force | Age > 16 Correlation Summary
| Measurement | Egyptian | Immigrants from Philippines |
| Minimum | 53.4% | 39.6% |
| Maximum | 90.9% | 88.4% |
| Range | 37.5% | 48.8% |
| Mean | 67.8% | 66.5% |
| Median | 66.9% | 65.8% |
| Interquartile 25% (IQ1) | 65.5% | 63.8% |
| Interquartile 75% (IQ3) | 69.4% | 68.3% |
| Interquartile Range (IQR) | 3.9% | 4.5% |
| Standard Deviation (Sample) | 5.5% | 7.5% |
| Standard Deviation (Population) | 5.5% | 7.5% |
Similar Demographics by In Labor Force | Age > 16
Demographics Similar to Egyptians by In Labor Force | Age > 16
In terms of in labor force | age > 16, the demographic groups most similar to Egyptians are Jordanian (66.3%, a difference of 0.020%), Sri Lankan (66.3%, a difference of 0.050%), Immigrants from Egypt (66.2%, a difference of 0.050%), Subsaharan African (66.2%, a difference of 0.050%), and Venezuelan (66.3%, a difference of 0.060%).
| Demographics | Rating | Rank | In Labor Force | Age > 16 |
| Immigrants | Peru | 99.8 /100 | #60 | Exceptional 66.3% |
| Immigrants | Burma/Myanmar | 99.8 /100 | #61 | Exceptional 66.3% |
| Indonesians | 99.8 /100 | #62 | Exceptional 66.3% |
| Venezuelans | 99.8 /100 | #63 | Exceptional 66.3% |
| Peruvians | 99.8 /100 | #64 | Exceptional 66.3% |
| Sri Lankans | 99.8 /100 | #65 | Exceptional 66.3% |
| Jordanians | 99.8 /100 | #66 | Exceptional 66.3% |
| Egyptians | 99.8 /100 | #67 | Exceptional 66.2% |
| Immigrants | Egypt | 99.7 /100 | #68 | Exceptional 66.2% |
| Sub-Saharan Africans | 99.7 /100 | #69 | Exceptional 66.2% |
| Asians | 99.7 /100 | #70 | Exceptional 66.2% |
| Burmese | 99.7 /100 | #71 | Exceptional 66.2% |
| Taiwanese | 99.7 /100 | #72 | Exceptional 66.2% |
| Immigrants | Vietnam | 99.7 /100 | #73 | Exceptional 66.2% |
| Immigrants | Korea | 99.7 /100 | #74 | Exceptional 66.2% |
Demographics Similar to Immigrants from Philippines by In Labor Force | Age > 16
In terms of in labor force | age > 16, the demographic groups most similar to Immigrants from Philippines are Immigrants from Guatemala (65.6%, a difference of 0.0%), Ecuadorian (65.6%, a difference of 0.010%), Icelander (65.6%, a difference of 0.010%), Immigrants from Eastern Asia (65.7%, a difference of 0.020%), and Immigrants from North Macedonia (65.6%, a difference of 0.020%).
| Demographics | Rating | Rank | In Labor Force | Age > 16 |
| Immigrants | Ecuador | 95.9 /100 | #122 | Exceptional 65.7% |
| Immigrants | Iraq | 95.5 /100 | #123 | Exceptional 65.7% |
| Iraqis | 95.4 /100 | #124 | Exceptional 65.7% |
| Norwegians | 95.3 /100 | #125 | Exceptional 65.7% |
| Koreans | 95.3 /100 | #126 | Exceptional 65.7% |
| Immigrants | Eastern Asia | 94.9 /100 | #127 | Exceptional 65.7% |
| Ecuadorians | 94.7 /100 | #128 | Exceptional 65.6% |
| Immigrants | Philippines | 94.5 /100 | #129 | Exceptional 65.6% |
| Immigrants | Guatemala | 94.4 /100 | #130 | Exceptional 65.6% |
| Icelanders | 94.3 /100 | #131 | Exceptional 65.6% |
| Immigrants | North Macedonia | 94.1 /100 | #132 | Exceptional 65.6% |
| Immigrants | Lithuania | 93.5 /100 | #133 | Exceptional 65.6% |
| Costa Ricans | 93.2 /100 | #134 | Exceptional 65.6% |
| Guatemalans | 92.5 /100 | #135 | Exceptional 65.6% |
| Immigrants | Argentina | 92.4 /100 | #136 | Exceptional 65.6% |