Creek vs Immigrants from Philippines In Labor Force | Age > 16
COMPARE
Creek
Immigrants from Philippines
In Labor Force | Age > 16
In Labor Force | Age > 16 Comparison
Creek
Immigrants from Philippines
61.3%
IN LABOR FORCE | AGE > 16
0.0/ 100
METRIC RATING
330th/ 347
METRIC RANK
65.6%
IN LABOR FORCE | AGE > 16
94.5/ 100
METRIC RATING
129th/ 347
METRIC RANK
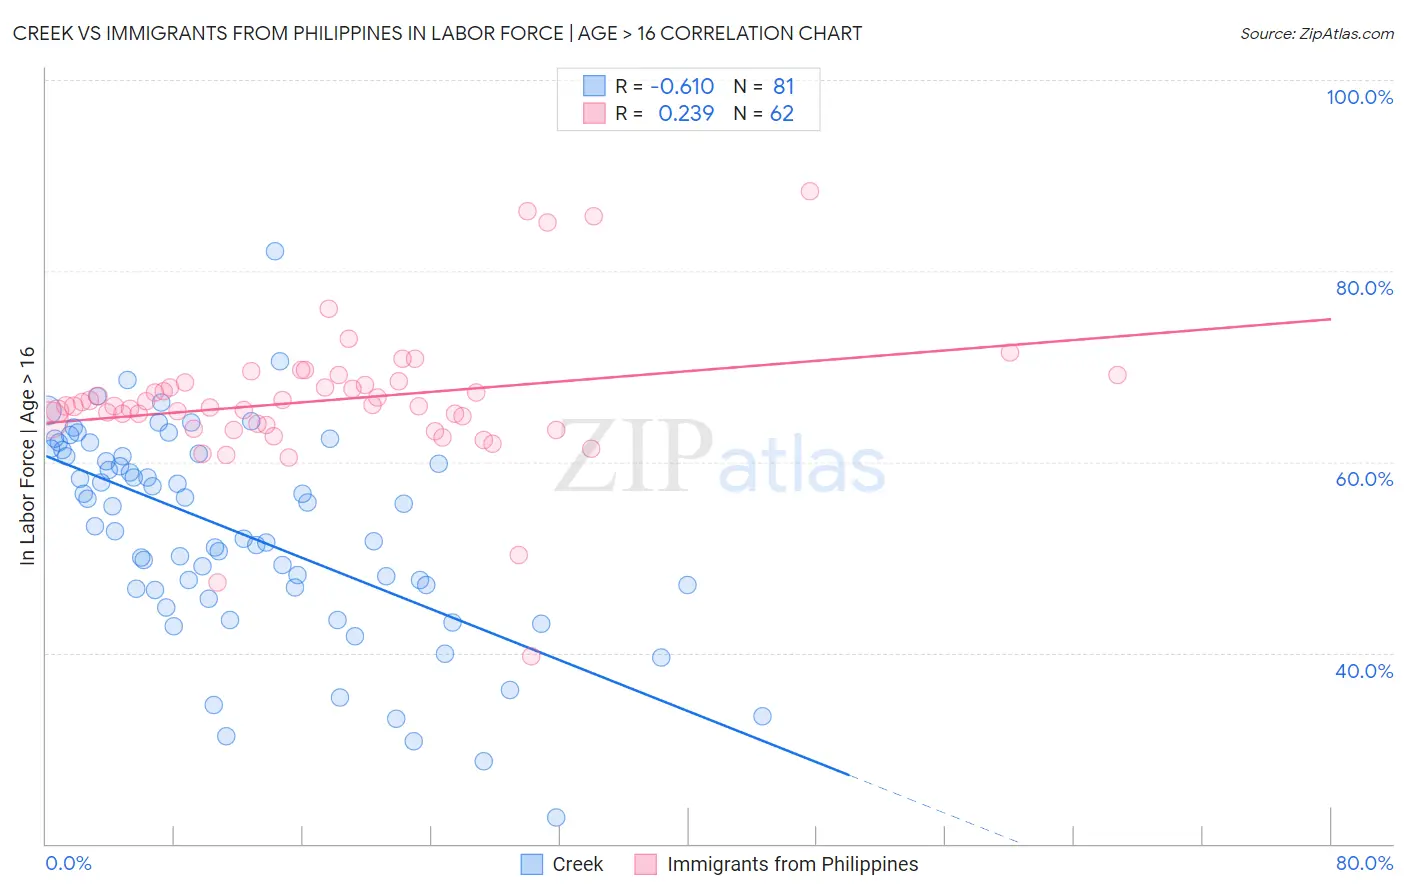
Creek vs Immigrants from Philippines In Labor Force | Age > 16 Correlation Chart
The statistical analysis conducted on geographies consisting of 178,467,646 people shows a significant negative correlation between the proportion of Creek and labor force participation rate among population ages 16 and over in the United States with a correlation coefficient (R) of -0.610 and weighted average of 61.3%. Similarly, the statistical analysis conducted on geographies consisting of 471,291,976 people shows a weak positive correlation between the proportion of Immigrants from Philippines and labor force participation rate among population ages 16 and over in the United States with a correlation coefficient (R) of 0.239 and weighted average of 65.6%, a difference of 7.0%.
In Labor Force | Age > 16 Correlation Summary
| Measurement | Creek | Immigrants from Philippines |
| Minimum | 22.8% | 39.6% |
| Maximum | 82.0% | 88.4% |
| Range | 59.2% | 48.8% |
| Mean | 52.6% | 66.5% |
| Median | 53.3% | 65.8% |
| Interquartile 25% (IQ1) | 46.6% | 63.8% |
| Interquartile 75% (IQ3) | 60.7% | 68.3% |
| Interquartile Range (IQR) | 14.0% | 4.5% |
| Standard Deviation (Sample) | 10.9% | 7.5% |
| Standard Deviation (Population) | 10.8% | 7.5% |
Similar Demographics by In Labor Force | Age > 16
Demographics Similar to Creek by In Labor Force | Age > 16
In terms of in labor force | age > 16, the demographic groups most similar to Creek are Choctaw (61.5%, a difference of 0.22%), Dutch West Indian (61.7%, a difference of 0.59%), Ute (60.9%, a difference of 0.71%), Cajun (61.8%, a difference of 0.74%), and Sioux (61.8%, a difference of 0.86%).
| Demographics | Rating | Rank | In Labor Force | Age > 16 |
| Seminole | 0.0 /100 | #323 | Tragic 62.0% |
| Cheyenne | 0.0 /100 | #324 | Tragic 62.0% |
| Cherokee | 0.0 /100 | #325 | Tragic 61.9% |
| Sioux | 0.0 /100 | #326 | Tragic 61.8% |
| Cajuns | 0.0 /100 | #327 | Tragic 61.8% |
| Dutch West Indians | 0.0 /100 | #328 | Tragic 61.7% |
| Choctaw | 0.0 /100 | #329 | Tragic 61.5% |
| Creek | 0.0 /100 | #330 | Tragic 61.3% |
| Ute | 0.0 /100 | #331 | Tragic 60.9% |
| Crow | 0.0 /100 | #332 | Tragic 60.8% |
| Paiute | 0.0 /100 | #333 | Tragic 60.7% |
| Apache | 0.0 /100 | #334 | Tragic 60.7% |
| Natives/Alaskans | 0.0 /100 | #335 | Tragic 60.6% |
| Menominee | 0.0 /100 | #336 | Tragic 60.6% |
| Colville | 0.0 /100 | #337 | Tragic 59.8% |
Demographics Similar to Immigrants from Philippines by In Labor Force | Age > 16
In terms of in labor force | age > 16, the demographic groups most similar to Immigrants from Philippines are Immigrants from Guatemala (65.6%, a difference of 0.0%), Ecuadorian (65.6%, a difference of 0.010%), Icelander (65.6%, a difference of 0.010%), Immigrants from Eastern Asia (65.7%, a difference of 0.020%), and Immigrants from North Macedonia (65.6%, a difference of 0.020%).
| Demographics | Rating | Rank | In Labor Force | Age > 16 |
| Immigrants | Ecuador | 95.9 /100 | #122 | Exceptional 65.7% |
| Immigrants | Iraq | 95.5 /100 | #123 | Exceptional 65.7% |
| Iraqis | 95.4 /100 | #124 | Exceptional 65.7% |
| Norwegians | 95.3 /100 | #125 | Exceptional 65.7% |
| Koreans | 95.3 /100 | #126 | Exceptional 65.7% |
| Immigrants | Eastern Asia | 94.9 /100 | #127 | Exceptional 65.7% |
| Ecuadorians | 94.7 /100 | #128 | Exceptional 65.6% |
| Immigrants | Philippines | 94.5 /100 | #129 | Exceptional 65.6% |
| Immigrants | Guatemala | 94.4 /100 | #130 | Exceptional 65.6% |
| Icelanders | 94.3 /100 | #131 | Exceptional 65.6% |
| Immigrants | North Macedonia | 94.1 /100 | #132 | Exceptional 65.6% |
| Immigrants | Lithuania | 93.5 /100 | #133 | Exceptional 65.6% |
| Costa Ricans | 93.2 /100 | #134 | Exceptional 65.6% |
| Guatemalans | 92.5 /100 | #135 | Exceptional 65.6% |
| Immigrants | Argentina | 92.4 /100 | #136 | Exceptional 65.6% |