Austrian vs Immigrants from Philippines In Labor Force | Age > 16
COMPARE
Austrian
Immigrants from Philippines
In Labor Force | Age > 16
In Labor Force | Age > 16 Comparison
Austrians
Immigrants from Philippines
64.6%
IN LABOR FORCE | AGE > 16
4.6/ 100
METRIC RATING
235th/ 347
METRIC RANK
65.6%
IN LABOR FORCE | AGE > 16
94.5/ 100
METRIC RATING
129th/ 347
METRIC RANK
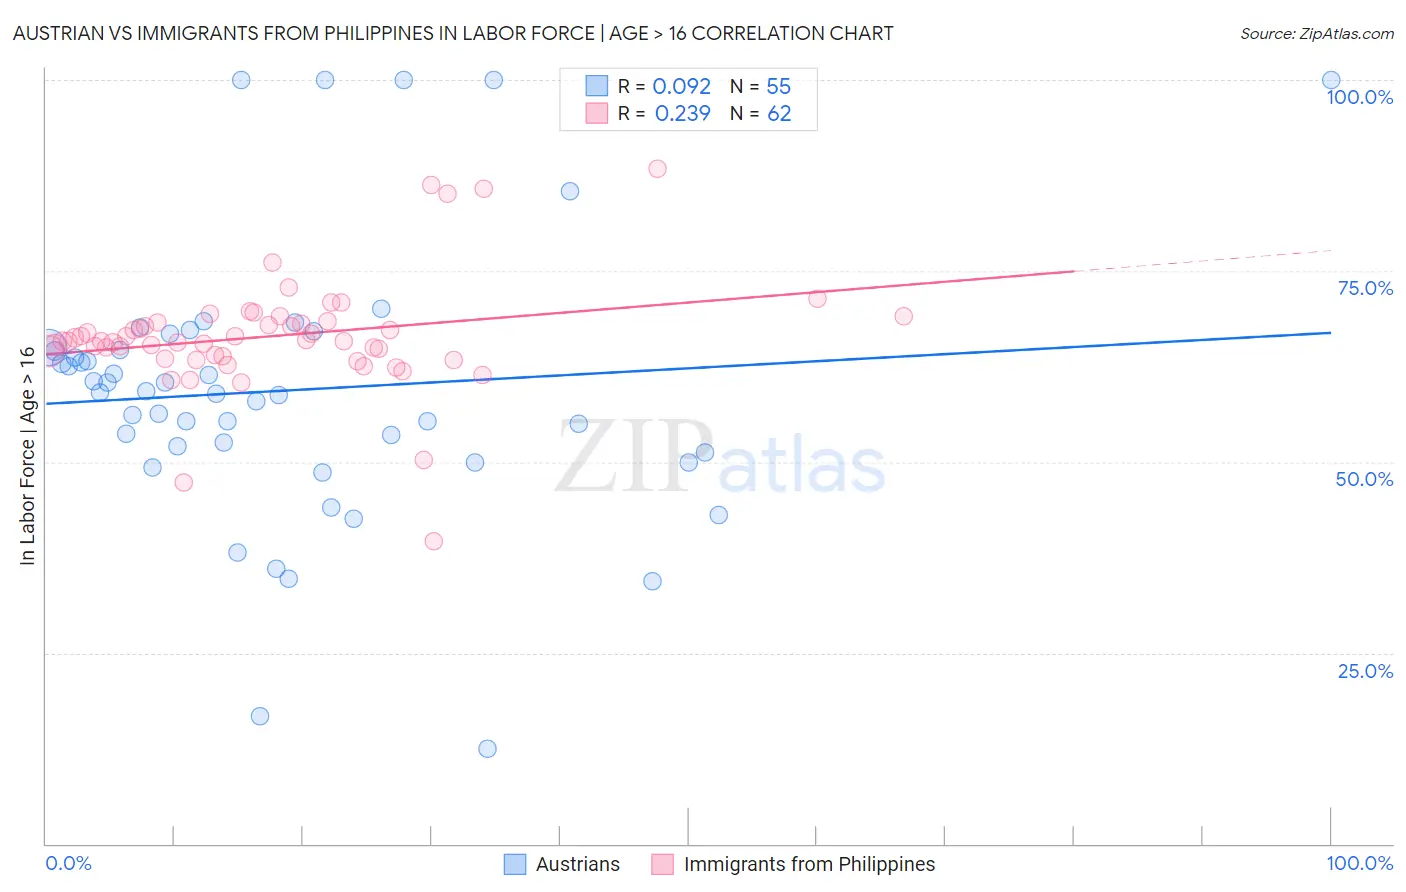
Austrian vs Immigrants from Philippines In Labor Force | Age > 16 Correlation Chart
The statistical analysis conducted on geographies consisting of 452,087,528 people shows a slight positive correlation between the proportion of Austrians and labor force participation rate among population ages 16 and over in the United States with a correlation coefficient (R) of 0.092 and weighted average of 64.6%. Similarly, the statistical analysis conducted on geographies consisting of 471,291,976 people shows a weak positive correlation between the proportion of Immigrants from Philippines and labor force participation rate among population ages 16 and over in the United States with a correlation coefficient (R) of 0.239 and weighted average of 65.6%, a difference of 1.7%.
In Labor Force | Age > 16 Correlation Summary
| Measurement | Austrian | Immigrants from Philippines |
| Minimum | 12.5% | 39.6% |
| Maximum | 100.0% | 88.4% |
| Range | 87.5% | 48.8% |
| Mean | 59.4% | 66.5% |
| Median | 59.1% | 65.8% |
| Interquartile 25% (IQ1) | 51.2% | 63.8% |
| Interquartile 75% (IQ3) | 65.0% | 68.3% |
| Interquartile Range (IQR) | 13.8% | 4.5% |
| Standard Deviation (Sample) | 17.9% | 7.5% |
| Standard Deviation (Population) | 17.8% | 7.5% |
Similar Demographics by In Labor Force | Age > 16
Demographics Similar to Austrians by In Labor Force | Age > 16
In terms of in labor force | age > 16, the demographic groups most similar to Austrians are Vietnamese (64.6%, a difference of 0.0%), Immigrants from Norway (64.6%, a difference of 0.0%), Italian (64.6%, a difference of 0.0%), Slavic (64.6%, a difference of 0.020%), and Lebanese (64.5%, a difference of 0.050%).
| Demographics | Rating | Rank | In Labor Force | Age > 16 |
| Northern Europeans | 8.2 /100 | #228 | Tragic 64.7% |
| British | 7.3 /100 | #229 | Tragic 64.7% |
| Chinese | 7.3 /100 | #230 | Tragic 64.7% |
| Immigrants | Northern Europe | 7.2 /100 | #231 | Tragic 64.7% |
| Africans | 5.8 /100 | #232 | Tragic 64.6% |
| Slavs | 4.9 /100 | #233 | Tragic 64.6% |
| Vietnamese | 4.7 /100 | #234 | Tragic 64.6% |
| Austrians | 4.6 /100 | #235 | Tragic 64.6% |
| Immigrants | Norway | 4.6 /100 | #236 | Tragic 64.6% |
| Italians | 4.6 /100 | #237 | Tragic 64.6% |
| Lebanese | 3.9 /100 | #238 | Tragic 64.5% |
| Immigrants | Hungary | 3.8 /100 | #239 | Tragic 64.5% |
| Immigrants | Bangladesh | 3.6 /100 | #240 | Tragic 64.5% |
| Immigrants | Dominica | 3.5 /100 | #241 | Tragic 64.5% |
| Immigrants | Netherlands | 3.4 /100 | #242 | Tragic 64.5% |
Demographics Similar to Immigrants from Philippines by In Labor Force | Age > 16
In terms of in labor force | age > 16, the demographic groups most similar to Immigrants from Philippines are Immigrants from Guatemala (65.6%, a difference of 0.0%), Ecuadorian (65.6%, a difference of 0.010%), Icelander (65.6%, a difference of 0.010%), Immigrants from Eastern Asia (65.7%, a difference of 0.020%), and Immigrants from North Macedonia (65.6%, a difference of 0.020%).
| Demographics | Rating | Rank | In Labor Force | Age > 16 |
| Immigrants | Ecuador | 95.9 /100 | #122 | Exceptional 65.7% |
| Immigrants | Iraq | 95.5 /100 | #123 | Exceptional 65.7% |
| Iraqis | 95.4 /100 | #124 | Exceptional 65.7% |
| Norwegians | 95.3 /100 | #125 | Exceptional 65.7% |
| Koreans | 95.3 /100 | #126 | Exceptional 65.7% |
| Immigrants | Eastern Asia | 94.9 /100 | #127 | Exceptional 65.7% |
| Ecuadorians | 94.7 /100 | #128 | Exceptional 65.6% |
| Immigrants | Philippines | 94.5 /100 | #129 | Exceptional 65.6% |
| Immigrants | Guatemala | 94.4 /100 | #130 | Exceptional 65.6% |
| Icelanders | 94.3 /100 | #131 | Exceptional 65.6% |
| Immigrants | North Macedonia | 94.1 /100 | #132 | Exceptional 65.6% |
| Immigrants | Lithuania | 93.5 /100 | #133 | Exceptional 65.6% |
| Costa Ricans | 93.2 /100 | #134 | Exceptional 65.6% |
| Guatemalans | 92.5 /100 | #135 | Exceptional 65.6% |
| Immigrants | Argentina | 92.4 /100 | #136 | Exceptional 65.6% |