Yugoslavian vs Immigrants from Ukraine In Labor Force | Age > 16
COMPARE
Yugoslavian
Immigrants from Ukraine
In Labor Force | Age > 16
In Labor Force | Age > 16 Comparison
Yugoslavians
Immigrants from Ukraine
65.4%
IN LABOR FORCE | AGE > 16
81.3/ 100
METRIC RATING
152nd/ 347
METRIC RANK
65.1%
IN LABOR FORCE | AGE > 16
53.7/ 100
METRIC RATING
173rd/ 347
METRIC RANK
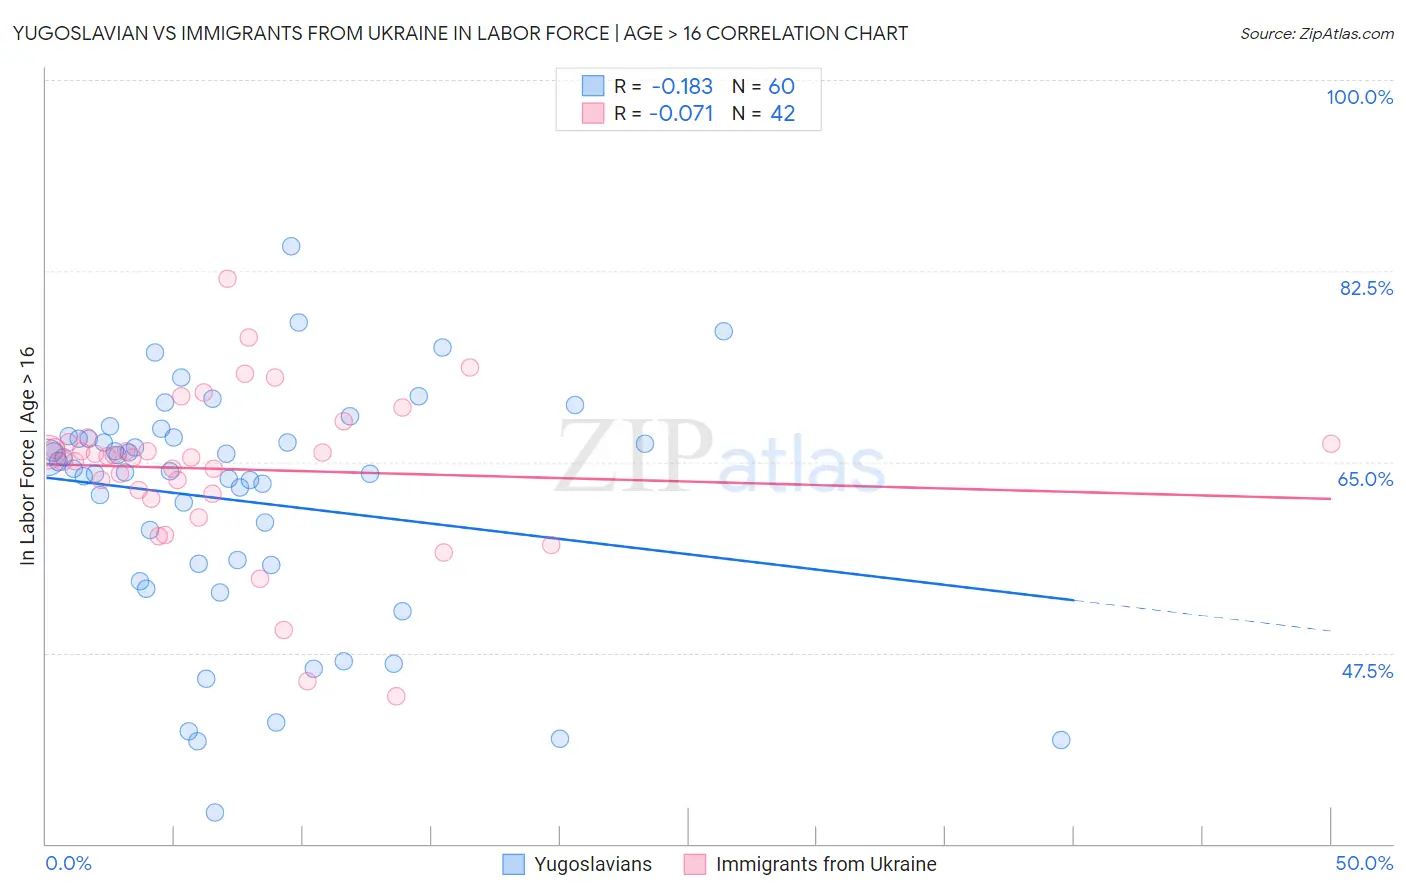
Yugoslavian vs Immigrants from Ukraine In Labor Force | Age > 16 Correlation Chart
The statistical analysis conducted on geographies consisting of 285,722,501 people shows a poor negative correlation between the proportion of Yugoslavians and labor force participation rate among population ages 16 and over in the United States with a correlation coefficient (R) of -0.183 and weighted average of 65.4%. Similarly, the statistical analysis conducted on geographies consisting of 289,705,583 people shows a slight negative correlation between the proportion of Immigrants from Ukraine and labor force participation rate among population ages 16 and over in the United States with a correlation coefficient (R) of -0.071 and weighted average of 65.1%, a difference of 0.37%.
In Labor Force | Age > 16 Correlation Summary
| Measurement | Yugoslavian | Immigrants from Ukraine |
| Minimum | 32.9% | 43.5% |
| Maximum | 84.8% | 81.8% |
| Range | 51.9% | 38.3% |
| Mean | 61.4% | 64.3% |
| Median | 64.3% | 65.5% |
| Interquartile 25% (IQ1) | 55.6% | 62.1% |
| Interquartile 75% (IQ3) | 67.2% | 66.8% |
| Interquartile Range (IQR) | 11.6% | 4.7% |
| Standard Deviation (Sample) | 10.9% | 7.4% |
| Standard Deviation (Population) | 10.8% | 7.3% |
Similar Demographics by In Labor Force | Age > 16
Demographics Similar to Yugoslavians by In Labor Force | Age > 16
In terms of in labor force | age > 16, the demographic groups most similar to Yugoslavians are Czech (65.4%, a difference of 0.0%), Immigrants (65.4%, a difference of 0.010%), Immigrants from China (65.4%, a difference of 0.010%), Immigrants from Eastern Europe (65.4%, a difference of 0.050%), and Immigrants from Armenia (65.3%, a difference of 0.080%).
| Demographics | Rating | Rank | In Labor Force | Age > 16 |
| Tlingit-Haida | 88.3 /100 | #145 | Excellent 65.5% |
| Cypriots | 88.2 /100 | #146 | Excellent 65.5% |
| Immigrants | Oceania | 87.5 /100 | #147 | Excellent 65.5% |
| Bhutanese | 86.3 /100 | #148 | Excellent 65.5% |
| Immigrants | Albania | 85.7 /100 | #149 | Excellent 65.4% |
| Immigrants | Immigrants | 81.9 /100 | #150 | Excellent 65.4% |
| Czechs | 81.5 /100 | #151 | Excellent 65.4% |
| Yugoslavians | 81.3 /100 | #152 | Excellent 65.4% |
| Immigrants | China | 80.5 /100 | #153 | Excellent 65.4% |
| Immigrants | Eastern Europe | 78.3 /100 | #154 | Good 65.4% |
| Immigrants | Armenia | 76.6 /100 | #155 | Good 65.3% |
| Immigrants | Ireland | 75.9 /100 | #156 | Good 65.3% |
| Immigrants | Russia | 75.7 /100 | #157 | Good 65.3% |
| Panamanians | 75.2 /100 | #158 | Good 65.3% |
| Immigrants | Syria | 74.6 /100 | #159 | Good 65.3% |
Demographics Similar to Immigrants from Ukraine by In Labor Force | Age > 16
In terms of in labor force | age > 16, the demographic groups most similar to Immigrants from Ukraine are Macedonian (65.1%, a difference of 0.040%), Nicaraguan (65.1%, a difference of 0.040%), Swedish (65.1%, a difference of 0.070%), Eastern European (65.1%, a difference of 0.080%), and Immigrants from Israel (65.2%, a difference of 0.090%).
| Demographics | Rating | Rank | In Labor Force | Age > 16 |
| Immigrants | Western Asia | 67.3 /100 | #166 | Good 65.3% |
| Immigrants | Belarus | 66.0 /100 | #167 | Good 65.2% |
| Serbians | 63.5 /100 | #168 | Good 65.2% |
| Arabs | 62.4 /100 | #169 | Good 65.2% |
| Immigrants | Israel | 61.7 /100 | #170 | Good 65.2% |
| Israelis | 61.6 /100 | #171 | Good 65.2% |
| Immigrants | Sweden | 61.3 /100 | #172 | Good 65.2% |
| Immigrants | Ukraine | 53.7 /100 | #173 | Average 65.1% |
| Macedonians | 50.0 /100 | #174 | Average 65.1% |
| Nicaraguans | 49.7 /100 | #175 | Average 65.1% |
| Swedes | 47.4 /100 | #176 | Average 65.1% |
| Eastern Europeans | 46.2 /100 | #177 | Average 65.1% |
| Trinidadians and Tobagonians | 45.2 /100 | #178 | Average 65.1% |
| Immigrants | Haiti | 43.3 /100 | #179 | Average 65.1% |
| Immigrants | Latvia | 42.9 /100 | #180 | Average 65.1% |