Yugoslavian vs Spanish American In Labor Force | Age > 16
COMPARE
Yugoslavian
Spanish American
In Labor Force | Age > 16
In Labor Force | Age > 16 Comparison
Yugoslavians
Spanish Americans
65.4%
IN LABOR FORCE | AGE > 16
81.3/ 100
METRIC RATING
152nd/ 347
METRIC RANK
63.6%
IN LABOR FORCE | AGE > 16
0.0/ 100
METRIC RATING
301st/ 347
METRIC RANK
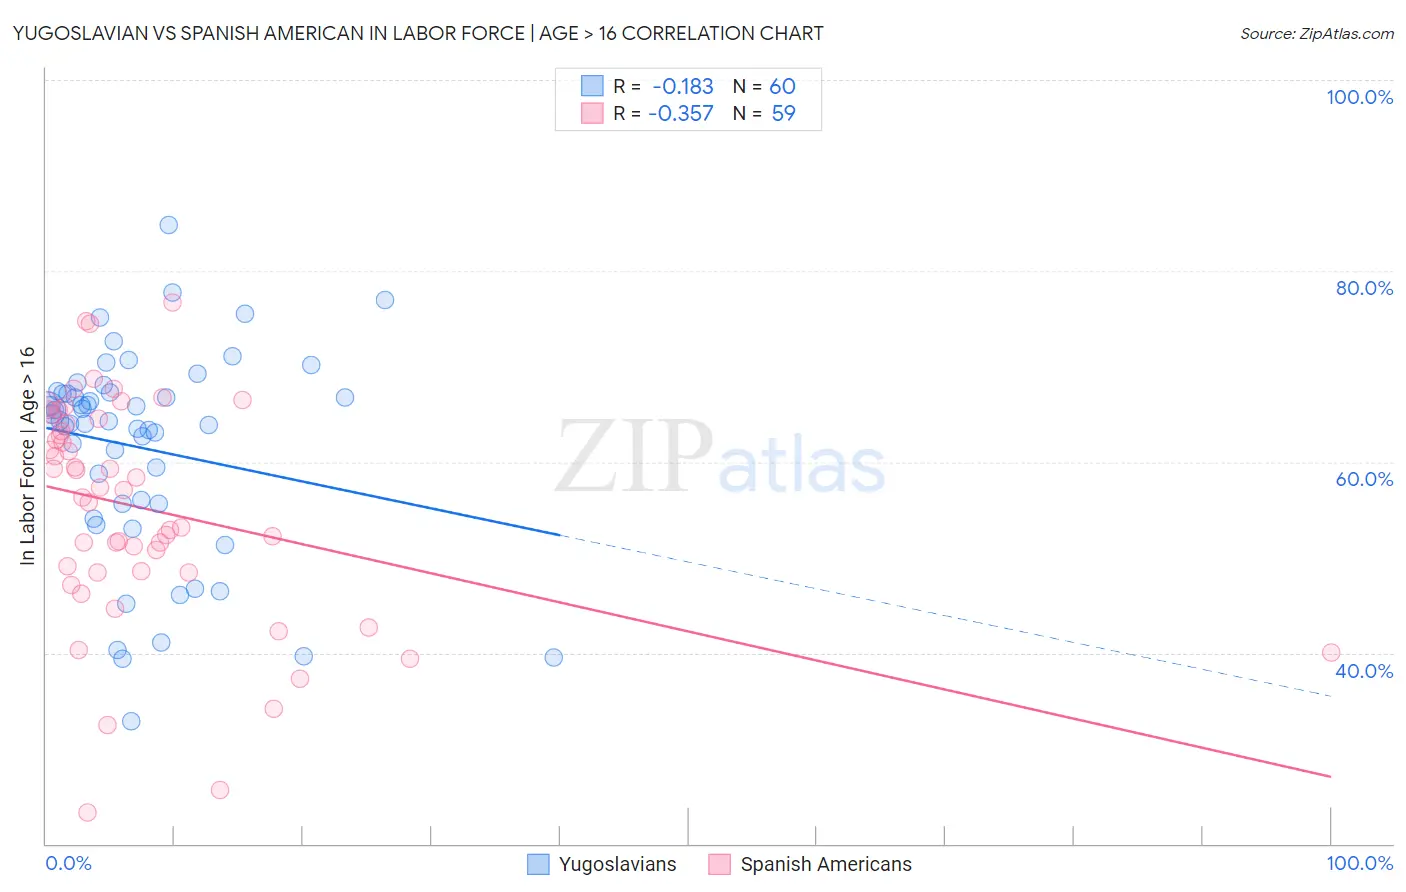
Yugoslavian vs Spanish American In Labor Force | Age > 16 Correlation Chart
The statistical analysis conducted on geographies consisting of 285,722,501 people shows a poor negative correlation between the proportion of Yugoslavians and labor force participation rate among population ages 16 and over in the United States with a correlation coefficient (R) of -0.183 and weighted average of 65.4%. Similarly, the statistical analysis conducted on geographies consisting of 103,168,383 people shows a mild negative correlation between the proportion of Spanish Americans and labor force participation rate among population ages 16 and over in the United States with a correlation coefficient (R) of -0.357 and weighted average of 63.6%, a difference of 2.9%.
In Labor Force | Age > 16 Correlation Summary
| Measurement | Yugoslavian | Spanish American |
| Minimum | 32.9% | 23.3% |
| Maximum | 84.8% | 76.7% |
| Range | 51.9% | 53.4% |
| Mean | 61.4% | 55.1% |
| Median | 64.3% | 57.0% |
| Interquartile 25% (IQ1) | 55.6% | 48.4% |
| Interquartile 75% (IQ3) | 67.2% | 64.5% |
| Interquartile Range (IQR) | 11.6% | 16.1% |
| Standard Deviation (Sample) | 10.9% | 11.7% |
| Standard Deviation (Population) | 10.8% | 11.6% |
Similar Demographics by In Labor Force | Age > 16
Demographics Similar to Yugoslavians by In Labor Force | Age > 16
In terms of in labor force | age > 16, the demographic groups most similar to Yugoslavians are Czech (65.4%, a difference of 0.0%), Immigrants (65.4%, a difference of 0.010%), Immigrants from China (65.4%, a difference of 0.010%), Immigrants from Eastern Europe (65.4%, a difference of 0.050%), and Immigrants from Armenia (65.3%, a difference of 0.080%).
| Demographics | Rating | Rank | In Labor Force | Age > 16 |
| Tlingit-Haida | 88.3 /100 | #145 | Excellent 65.5% |
| Cypriots | 88.2 /100 | #146 | Excellent 65.5% |
| Immigrants | Oceania | 87.5 /100 | #147 | Excellent 65.5% |
| Bhutanese | 86.3 /100 | #148 | Excellent 65.5% |
| Immigrants | Albania | 85.7 /100 | #149 | Excellent 65.4% |
| Immigrants | Immigrants | 81.9 /100 | #150 | Excellent 65.4% |
| Czechs | 81.5 /100 | #151 | Excellent 65.4% |
| Yugoslavians | 81.3 /100 | #152 | Excellent 65.4% |
| Immigrants | China | 80.5 /100 | #153 | Excellent 65.4% |
| Immigrants | Eastern Europe | 78.3 /100 | #154 | Good 65.4% |
| Immigrants | Armenia | 76.6 /100 | #155 | Good 65.3% |
| Immigrants | Ireland | 75.9 /100 | #156 | Good 65.3% |
| Immigrants | Russia | 75.7 /100 | #157 | Good 65.3% |
| Panamanians | 75.2 /100 | #158 | Good 65.3% |
| Immigrants | Syria | 74.6 /100 | #159 | Good 65.3% |
Demographics Similar to Spanish Americans by In Labor Force | Age > 16
In terms of in labor force | age > 16, the demographic groups most similar to Spanish Americans are Delaware (63.6%, a difference of 0.010%), White/Caucasian (63.6%, a difference of 0.030%), Immigrants from the Azores (63.6%, a difference of 0.030%), Cree (63.5%, a difference of 0.050%), and Comanche (63.6%, a difference of 0.090%).
| Demographics | Rating | Rank | In Labor Force | Age > 16 |
| Puget Sound Salish | 0.0 /100 | #294 | Tragic 63.7% |
| Immigrants | Canada | 0.0 /100 | #295 | Tragic 63.7% |
| Immigrants | North America | 0.0 /100 | #296 | Tragic 63.7% |
| Immigrants | Grenada | 0.0 /100 | #297 | Tragic 63.6% |
| Comanche | 0.0 /100 | #298 | Tragic 63.6% |
| Whites/Caucasians | 0.0 /100 | #299 | Tragic 63.6% |
| Immigrants | Azores | 0.0 /100 | #300 | Tragic 63.6% |
| Spanish Americans | 0.0 /100 | #301 | Tragic 63.6% |
| Delaware | 0.0 /100 | #302 | Tragic 63.6% |
| Cree | 0.0 /100 | #303 | Tragic 63.5% |
| Immigrants | Nonimmigrants | 0.0 /100 | #304 | Tragic 63.5% |
| Osage | 0.0 /100 | #305 | Tragic 63.5% |
| Blacks/African Americans | 0.0 /100 | #306 | Tragic 63.4% |
| Central American Indians | 0.0 /100 | #307 | Tragic 63.4% |
| Pennsylvania Germans | 0.0 /100 | #308 | Tragic 63.4% |