Yugoslavian vs Carpatho Rusyn In Labor Force | Age > 16
COMPARE
Yugoslavian
Carpatho Rusyn
In Labor Force | Age > 16
In Labor Force | Age > 16 Comparison
Yugoslavians
Carpatho Rusyns
65.4%
IN LABOR FORCE | AGE > 16
81.3/ 100
METRIC RATING
152nd/ 347
METRIC RANK
65.0%
IN LABOR FORCE | AGE > 16
40.0/ 100
METRIC RATING
184th/ 347
METRIC RANK
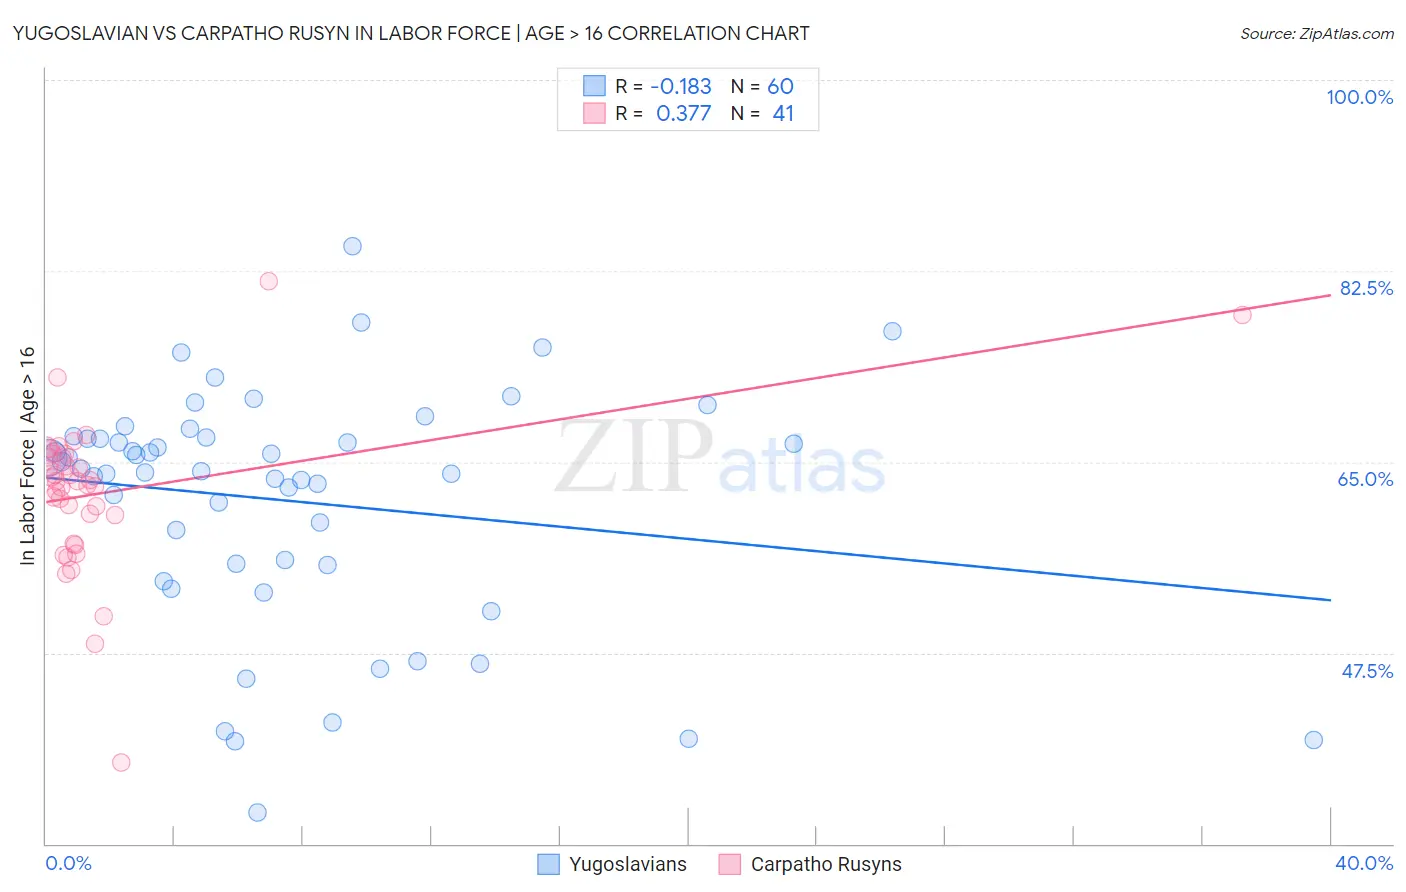
Yugoslavian vs Carpatho Rusyn In Labor Force | Age > 16 Correlation Chart
The statistical analysis conducted on geographies consisting of 285,722,501 people shows a poor negative correlation between the proportion of Yugoslavians and labor force participation rate among population ages 16 and over in the United States with a correlation coefficient (R) of -0.183 and weighted average of 65.4%. Similarly, the statistical analysis conducted on geographies consisting of 58,872,150 people shows a mild positive correlation between the proportion of Carpatho Rusyns and labor force participation rate among population ages 16 and over in the United States with a correlation coefficient (R) of 0.377 and weighted average of 65.0%, a difference of 0.52%.
In Labor Force | Age > 16 Correlation Summary
| Measurement | Yugoslavian | Carpatho Rusyn |
| Minimum | 32.9% | 37.5% |
| Maximum | 84.8% | 81.5% |
| Range | 51.9% | 44.0% |
| Mean | 61.4% | 62.2% |
| Median | 64.3% | 63.2% |
| Interquartile 25% (IQ1) | 55.6% | 58.8% |
| Interquartile 75% (IQ3) | 67.2% | 65.5% |
| Interquartile Range (IQR) | 11.6% | 6.7% |
| Standard Deviation (Sample) | 10.9% | 7.3% |
| Standard Deviation (Population) | 10.8% | 7.2% |
Similar Demographics by In Labor Force | Age > 16
Demographics Similar to Yugoslavians by In Labor Force | Age > 16
In terms of in labor force | age > 16, the demographic groups most similar to Yugoslavians are Czech (65.4%, a difference of 0.0%), Immigrants (65.4%, a difference of 0.010%), Immigrants from China (65.4%, a difference of 0.010%), Immigrants from Eastern Europe (65.4%, a difference of 0.050%), and Immigrants from Armenia (65.3%, a difference of 0.080%).
| Demographics | Rating | Rank | In Labor Force | Age > 16 |
| Tlingit-Haida | 88.3 /100 | #145 | Excellent 65.5% |
| Cypriots | 88.2 /100 | #146 | Excellent 65.5% |
| Immigrants | Oceania | 87.5 /100 | #147 | Excellent 65.5% |
| Bhutanese | 86.3 /100 | #148 | Excellent 65.5% |
| Immigrants | Albania | 85.7 /100 | #149 | Excellent 65.4% |
| Immigrants | Immigrants | 81.9 /100 | #150 | Excellent 65.4% |
| Czechs | 81.5 /100 | #151 | Excellent 65.4% |
| Yugoslavians | 81.3 /100 | #152 | Excellent 65.4% |
| Immigrants | China | 80.5 /100 | #153 | Excellent 65.4% |
| Immigrants | Eastern Europe | 78.3 /100 | #154 | Good 65.4% |
| Immigrants | Armenia | 76.6 /100 | #155 | Good 65.3% |
| Immigrants | Ireland | 75.9 /100 | #156 | Good 65.3% |
| Immigrants | Russia | 75.7 /100 | #157 | Good 65.3% |
| Panamanians | 75.2 /100 | #158 | Good 65.3% |
| Immigrants | Syria | 74.6 /100 | #159 | Good 65.3% |
Demographics Similar to Carpatho Rusyns by In Labor Force | Age > 16
In terms of in labor force | age > 16, the demographic groups most similar to Carpatho Rusyns are Syrian (65.0%, a difference of 0.0%), Immigrants from Nicaragua (65.1%, a difference of 0.010%), Soviet Union (65.0%, a difference of 0.010%), Immigrants from Switzerland (65.0%, a difference of 0.020%), and Immigrants from Latvia (65.1%, a difference of 0.030%).
| Demographics | Rating | Rank | In Labor Force | Age > 16 |
| Eastern Europeans | 46.2 /100 | #177 | Average 65.1% |
| Trinidadians and Tobagonians | 45.2 /100 | #178 | Average 65.1% |
| Immigrants | Haiti | 43.3 /100 | #179 | Average 65.1% |
| Immigrants | Latvia | 42.9 /100 | #180 | Average 65.1% |
| Immigrants | Panama | 42.4 /100 | #181 | Average 65.1% |
| Immigrants | Nicaragua | 41.1 /100 | #182 | Average 65.1% |
| Soviet Union | 40.5 /100 | #183 | Average 65.0% |
| Carpatho Rusyns | 40.0 /100 | #184 | Average 65.0% |
| Syrians | 40.0 /100 | #185 | Average 65.0% |
| Immigrants | Switzerland | 38.2 /100 | #186 | Fair 65.0% |
| Immigrants | Croatia | 35.7 /100 | #187 | Fair 65.0% |
| Immigrants | Portugal | 34.8 /100 | #188 | Fair 65.0% |
| Immigrants | Greece | 34.3 /100 | #189 | Fair 65.0% |
| Barbadians | 33.9 /100 | #190 | Fair 65.0% |
| Scandinavians | 33.7 /100 | #191 | Fair 65.0% |