Yugoslavian vs Immigrants from Bosnia and Herzegovina In Labor Force | Age > 16
COMPARE
Yugoslavian
Immigrants from Bosnia and Herzegovina
In Labor Force | Age > 16
In Labor Force | Age > 16 Comparison
Yugoslavians
Immigrants from Bosnia and Herzegovina
65.4%
IN LABOR FORCE | AGE > 16
81.3/ 100
METRIC RATING
152nd/ 347
METRIC RANK
66.5%
IN LABOR FORCE | AGE > 16
99.9/ 100
METRIC RATING
54th/ 347
METRIC RANK
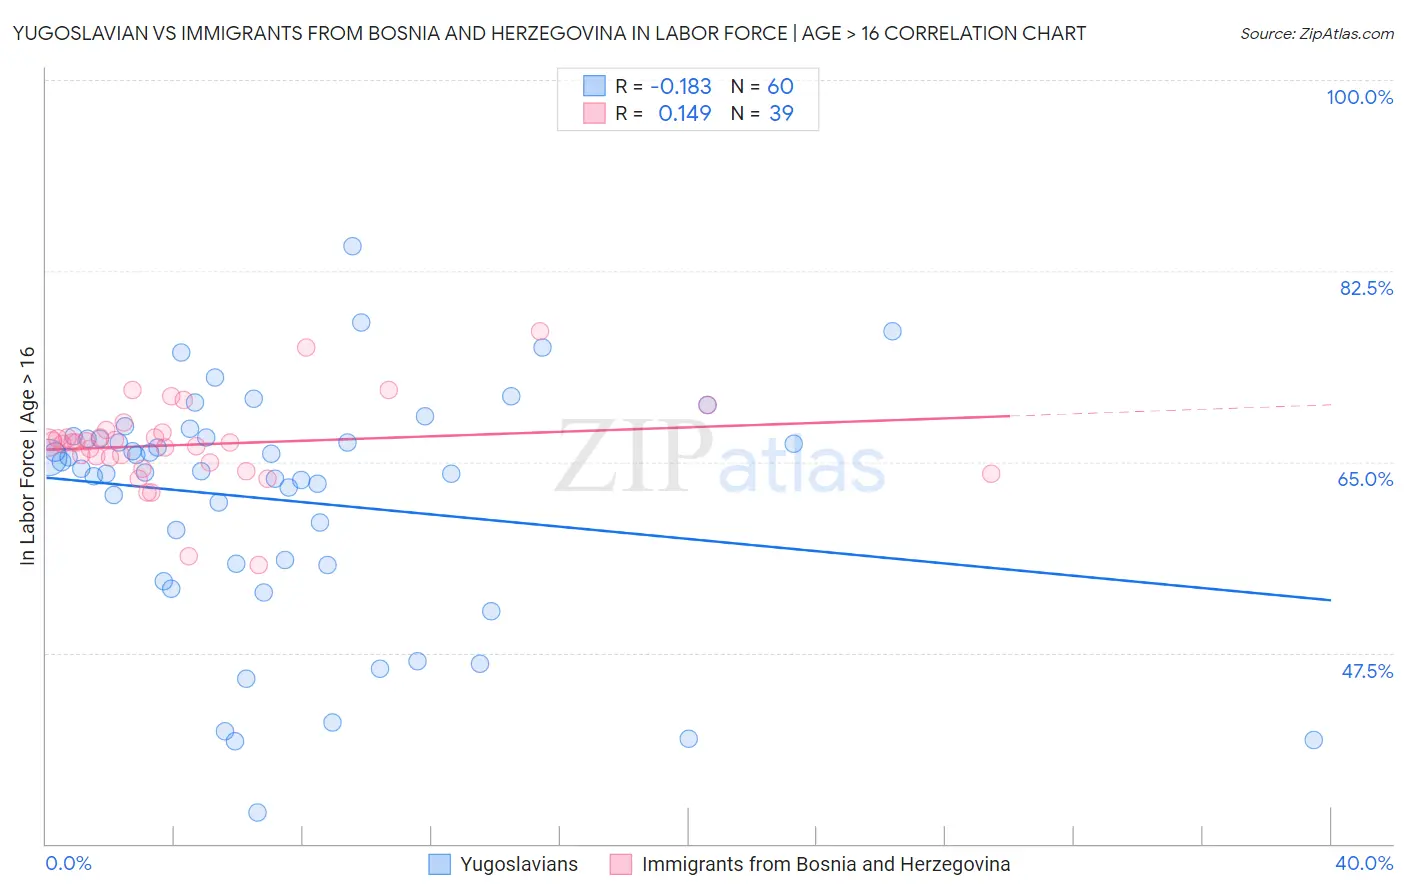
Yugoslavian vs Immigrants from Bosnia and Herzegovina In Labor Force | Age > 16 Correlation Chart
The statistical analysis conducted on geographies consisting of 285,722,501 people shows a poor negative correlation between the proportion of Yugoslavians and labor force participation rate among population ages 16 and over in the United States with a correlation coefficient (R) of -0.183 and weighted average of 65.4%. Similarly, the statistical analysis conducted on geographies consisting of 156,819,568 people shows a poor positive correlation between the proportion of Immigrants from Bosnia and Herzegovina and labor force participation rate among population ages 16 and over in the United States with a correlation coefficient (R) of 0.149 and weighted average of 66.5%, a difference of 1.6%.
In Labor Force | Age > 16 Correlation Summary
| Measurement | Yugoslavian | Immigrants from Bosnia and Herzegovina |
| Minimum | 32.9% | 55.6% |
| Maximum | 84.8% | 77.0% |
| Range | 51.9% | 21.4% |
| Mean | 61.4% | 66.6% |
| Median | 64.3% | 66.8% |
| Interquartile 25% (IQ1) | 55.6% | 65.0% |
| Interquartile 75% (IQ3) | 67.2% | 67.7% |
| Interquartile Range (IQR) | 11.6% | 2.8% |
| Standard Deviation (Sample) | 10.9% | 4.0% |
| Standard Deviation (Population) | 10.8% | 3.9% |
Similar Demographics by In Labor Force | Age > 16
Demographics Similar to Yugoslavians by In Labor Force | Age > 16
In terms of in labor force | age > 16, the demographic groups most similar to Yugoslavians are Czech (65.4%, a difference of 0.0%), Immigrants (65.4%, a difference of 0.010%), Immigrants from China (65.4%, a difference of 0.010%), Immigrants from Eastern Europe (65.4%, a difference of 0.050%), and Immigrants from Armenia (65.3%, a difference of 0.080%).
| Demographics | Rating | Rank | In Labor Force | Age > 16 |
| Tlingit-Haida | 88.3 /100 | #145 | Excellent 65.5% |
| Cypriots | 88.2 /100 | #146 | Excellent 65.5% |
| Immigrants | Oceania | 87.5 /100 | #147 | Excellent 65.5% |
| Bhutanese | 86.3 /100 | #148 | Excellent 65.5% |
| Immigrants | Albania | 85.7 /100 | #149 | Excellent 65.4% |
| Immigrants | Immigrants | 81.9 /100 | #150 | Excellent 65.4% |
| Czechs | 81.5 /100 | #151 | Excellent 65.4% |
| Yugoslavians | 81.3 /100 | #152 | Excellent 65.4% |
| Immigrants | China | 80.5 /100 | #153 | Excellent 65.4% |
| Immigrants | Eastern Europe | 78.3 /100 | #154 | Good 65.4% |
| Immigrants | Armenia | 76.6 /100 | #155 | Good 65.3% |
| Immigrants | Ireland | 75.9 /100 | #156 | Good 65.3% |
| Immigrants | Russia | 75.7 /100 | #157 | Good 65.3% |
| Panamanians | 75.2 /100 | #158 | Good 65.3% |
| Immigrants | Syria | 74.6 /100 | #159 | Good 65.3% |
Demographics Similar to Immigrants from Bosnia and Herzegovina by In Labor Force | Age > 16
In terms of in labor force | age > 16, the demographic groups most similar to Immigrants from Bosnia and Herzegovina are Immigrants from Sri Lanka (66.5%, a difference of 0.030%), Paraguayan (66.5%, a difference of 0.050%), Immigrants from Venezuela (66.4%, a difference of 0.050%), Immigrants from Kuwait (66.5%, a difference of 0.080%), and Immigrants from Senegal (66.4%, a difference of 0.080%).
| Demographics | Rating | Rank | In Labor Force | Age > 16 |
| Immigrants | Bulgaria | 100.0 /100 | #47 | Exceptional 66.6% |
| Nigerians | 100.0 /100 | #48 | Exceptional 66.6% |
| Immigrants | Northern Africa | 100.0 /100 | #49 | Exceptional 66.6% |
| Cape Verdeans | 100.0 /100 | #50 | Exceptional 66.6% |
| Immigrants | Kuwait | 100.0 /100 | #51 | Exceptional 66.5% |
| Paraguayans | 99.9 /100 | #52 | Exceptional 66.5% |
| Immigrants | Sri Lanka | 99.9 /100 | #53 | Exceptional 66.5% |
| Immigrants | Bosnia and Herzegovina | 99.9 /100 | #54 | Exceptional 66.5% |
| Immigrants | Venezuela | 99.9 /100 | #55 | Exceptional 66.4% |
| Immigrants | Senegal | 99.9 /100 | #56 | Exceptional 66.4% |
| Bulgarians | 99.9 /100 | #57 | Exceptional 66.4% |
| Immigrants | Saudi Arabia | 99.9 /100 | #58 | Exceptional 66.3% |
| Immigrants | Turkey | 99.9 /100 | #59 | Exceptional 66.3% |
| Immigrants | Peru | 99.8 /100 | #60 | Exceptional 66.3% |
| Immigrants | Burma/Myanmar | 99.8 /100 | #61 | Exceptional 66.3% |