Osage vs Pakistani In Labor Force | Age 16-19
COMPARE
Osage
Pakistani
In Labor Force | Age 16-19
In Labor Force | Age 16-19 Comparison
Osage
Pakistanis
39.0%
IN LABOR FORCE | AGE 16-19
99.4/ 100
METRIC RATING
92nd/ 347
METRIC RANK
37.6%
IN LABOR FORCE | AGE 16-19
89.5/ 100
METRIC RATING
143rd/ 347
METRIC RANK
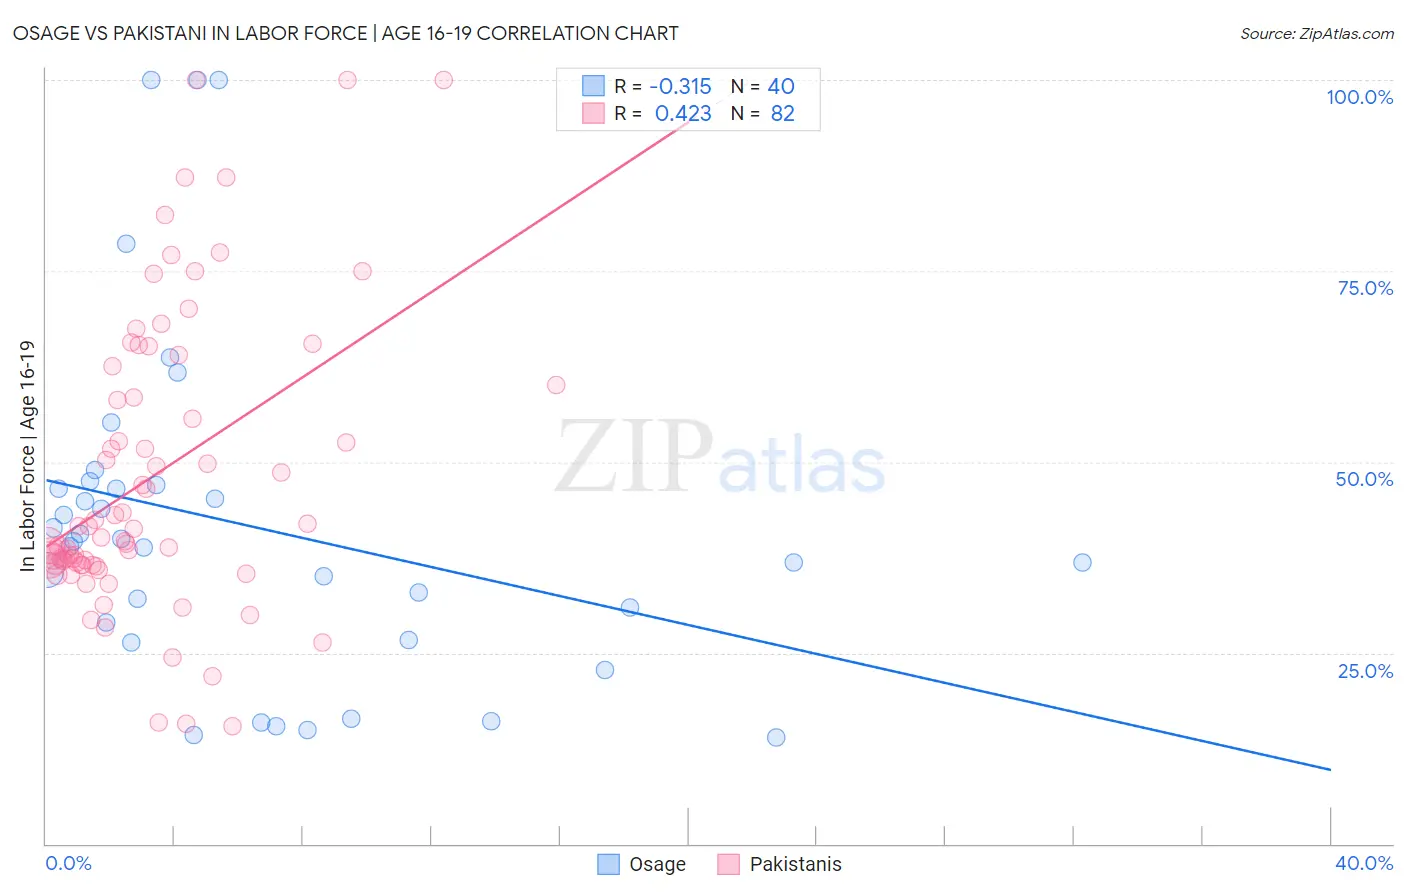
Osage vs Pakistani In Labor Force | Age 16-19 Correlation Chart
The statistical analysis conducted on geographies consisting of 91,776,050 people shows a mild negative correlation between the proportion of Osage and labor force participation rate among population between the ages 16 and 19 in the United States with a correlation coefficient (R) of -0.315 and weighted average of 39.0%. Similarly, the statistical analysis conducted on geographies consisting of 335,000,628 people shows a moderate positive correlation between the proportion of Pakistanis and labor force participation rate among population between the ages 16 and 19 in the United States with a correlation coefficient (R) of 0.423 and weighted average of 37.6%, a difference of 3.7%.
In Labor Force | Age 16-19 Correlation Summary
| Measurement | Osage | Pakistani |
| Minimum | 13.9% | 15.4% |
| Maximum | 100.0% | 100.0% |
| Range | 86.1% | 84.6% |
| Mean | 41.6% | 48.1% |
| Median | 39.3% | 40.7% |
| Interquartile 25% (IQ1) | 27.8% | 36.5% |
| Interquartile 75% (IQ3) | 46.7% | 60.0% |
| Interquartile Range (IQR) | 19.0% | 23.5% |
| Standard Deviation (Sample) | 22.1% | 19.2% |
| Standard Deviation (Population) | 21.9% | 19.1% |
Similar Demographics by In Labor Force | Age 16-19
Demographics Similar to Osage by In Labor Force | Age 16-19
In terms of in labor force | age 16-19, the demographic groups most similar to Osage are Blackfeet (38.9%, a difference of 0.060%), Immigrants from Canada (38.9%, a difference of 0.060%), Spanish American (39.0%, a difference of 0.090%), Immigrants from North America (38.9%, a difference of 0.15%), and Latvian (38.9%, a difference of 0.18%).
| Demographics | Rating | Rank | In Labor Force | Age 16-19 |
| Creek | 99.6 /100 | #85 | Exceptional 39.1% |
| Samoans | 99.6 /100 | #86 | Exceptional 39.1% |
| Immigrants | Germany | 99.6 /100 | #87 | Exceptional 39.1% |
| Puget Sound Salish | 99.6 /100 | #88 | Exceptional 39.1% |
| Alaska Natives | 99.6 /100 | #89 | Exceptional 39.1% |
| Immigrants | Burma/Myanmar | 99.5 /100 | #90 | Exceptional 39.0% |
| Spanish Americans | 99.5 /100 | #91 | Exceptional 39.0% |
| Osage | 99.4 /100 | #92 | Exceptional 39.0% |
| Blackfeet | 99.4 /100 | #93 | Exceptional 38.9% |
| Immigrants | Canada | 99.4 /100 | #94 | Exceptional 38.9% |
| Immigrants | North America | 99.4 /100 | #95 | Exceptional 38.9% |
| Latvians | 99.4 /100 | #96 | Exceptional 38.9% |
| Greeks | 99.3 /100 | #97 | Exceptional 38.9% |
| Ugandans | 99.3 /100 | #98 | Exceptional 38.9% |
| Immigrants | North Macedonia | 99.3 /100 | #99 | Exceptional 38.9% |
Demographics Similar to Pakistanis by In Labor Force | Age 16-19
In terms of in labor force | age 16-19, the demographic groups most similar to Pakistanis are Japanese (37.5%, a difference of 0.020%), Paiute (37.5%, a difference of 0.020%), Sierra Leonean (37.6%, a difference of 0.030%), Immigrants from Western Europe (37.5%, a difference of 0.070%), and Brazilian (37.5%, a difference of 0.10%).
| Demographics | Rating | Rank | In Labor Force | Age 16-19 |
| Australians | 93.2 /100 | #136 | Exceptional 37.8% |
| Cajuns | 93.2 /100 | #137 | Exceptional 37.8% |
| Comanche | 91.9 /100 | #138 | Exceptional 37.7% |
| Immigrants | Moldova | 91.9 /100 | #139 | Exceptional 37.7% |
| Estonians | 91.7 /100 | #140 | Exceptional 37.7% |
| Syrians | 90.7 /100 | #141 | Exceptional 37.6% |
| Sierra Leoneans | 89.7 /100 | #142 | Excellent 37.6% |
| Pakistanis | 89.5 /100 | #143 | Excellent 37.6% |
| Japanese | 89.3 /100 | #144 | Excellent 37.5% |
| Paiute | 89.3 /100 | #145 | Excellent 37.5% |
| Immigrants | Western Europe | 88.9 /100 | #146 | Excellent 37.5% |
| Brazilians | 88.7 /100 | #147 | Excellent 37.5% |
| Romanians | 87.3 /100 | #148 | Excellent 37.5% |
| Native Hawaiians | 85.0 /100 | #149 | Excellent 37.4% |
| Tsimshian | 84.7 /100 | #150 | Excellent 37.4% |