Osage vs English In Labor Force | Age 16-19
COMPARE
Osage
English
In Labor Force | Age 16-19
In Labor Force | Age 16-19 Comparison
Osage
English
39.0%
IN LABOR FORCE | AGE 16-19
99.4/ 100
METRIC RATING
92nd/ 347
METRIC RANK
42.4%
IN LABOR FORCE | AGE 16-19
100.0/ 100
METRIC RATING
26th/ 347
METRIC RANK
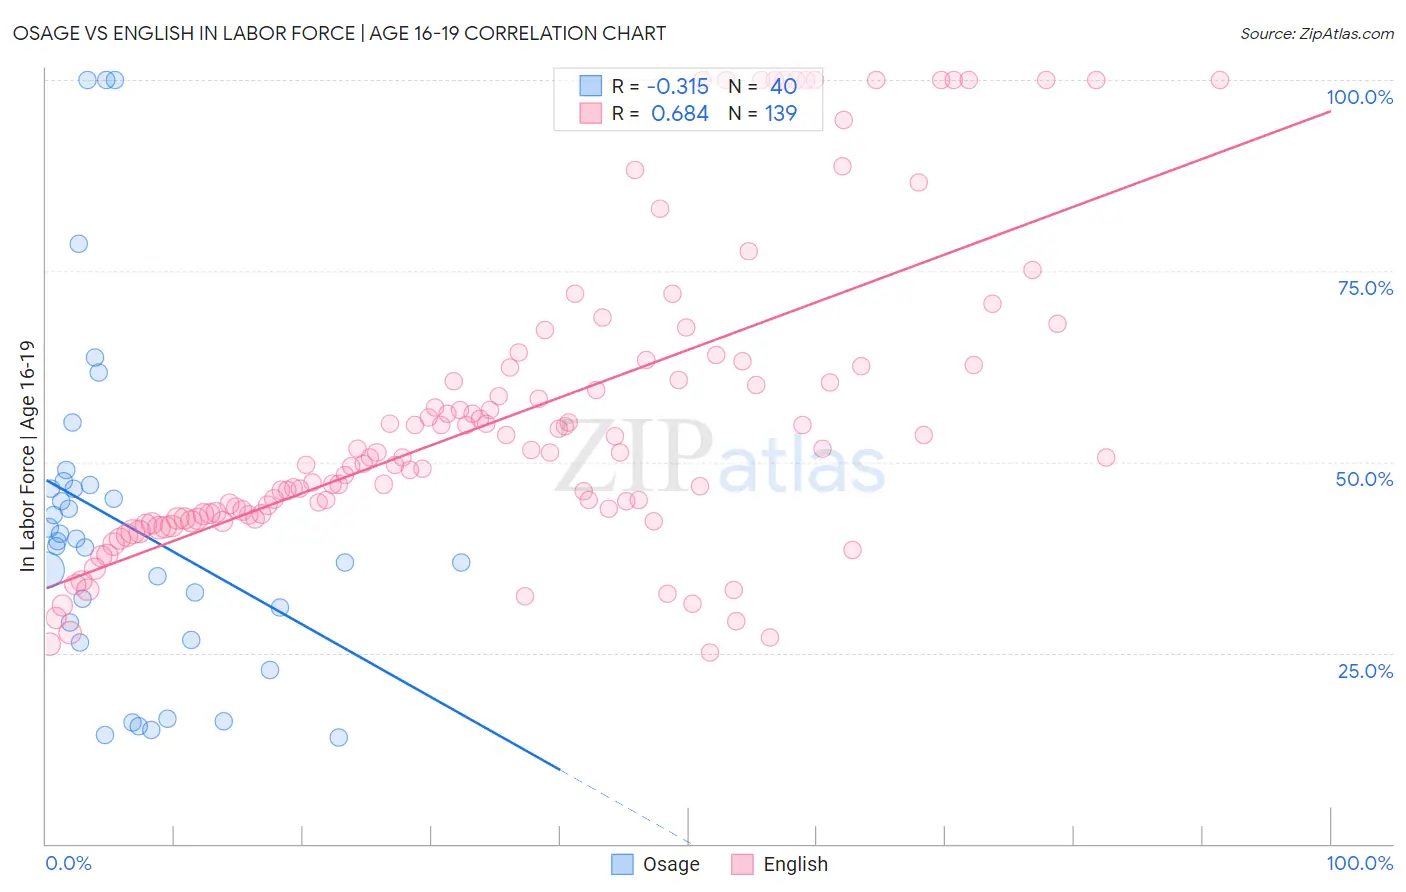
Osage vs English In Labor Force | Age 16-19 Correlation Chart
The statistical analysis conducted on geographies consisting of 91,776,050 people shows a mild negative correlation between the proportion of Osage and labor force participation rate among population between the ages 16 and 19 in the United States with a correlation coefficient (R) of -0.315 and weighted average of 39.0%. Similarly, the statistical analysis conducted on geographies consisting of 574,065,457 people shows a significant positive correlation between the proportion of English and labor force participation rate among population between the ages 16 and 19 in the United States with a correlation coefficient (R) of 0.684 and weighted average of 42.4%, a difference of 8.8%.
In Labor Force | Age 16-19 Correlation Summary
| Measurement | Osage | English |
| Minimum | 13.9% | 25.0% |
| Maximum | 100.0% | 100.0% |
| Range | 86.1% | 75.0% |
| Mean | 41.6% | 55.8% |
| Median | 39.3% | 50.5% |
| Interquartile 25% (IQ1) | 27.8% | 42.6% |
| Interquartile 75% (IQ3) | 46.7% | 62.5% |
| Interquartile Range (IQR) | 19.0% | 19.9% |
| Standard Deviation (Sample) | 22.1% | 19.9% |
| Standard Deviation (Population) | 21.9% | 19.8% |
Similar Demographics by In Labor Force | Age 16-19
Demographics Similar to Osage by In Labor Force | Age 16-19
In terms of in labor force | age 16-19, the demographic groups most similar to Osage are Blackfeet (38.9%, a difference of 0.060%), Immigrants from Canada (38.9%, a difference of 0.060%), Spanish American (39.0%, a difference of 0.090%), Immigrants from North America (38.9%, a difference of 0.15%), and Latvian (38.9%, a difference of 0.18%).
| Demographics | Rating | Rank | In Labor Force | Age 16-19 |
| Creek | 99.6 /100 | #85 | Exceptional 39.1% |
| Samoans | 99.6 /100 | #86 | Exceptional 39.1% |
| Immigrants | Germany | 99.6 /100 | #87 | Exceptional 39.1% |
| Puget Sound Salish | 99.6 /100 | #88 | Exceptional 39.1% |
| Alaska Natives | 99.6 /100 | #89 | Exceptional 39.1% |
| Immigrants | Burma/Myanmar | 99.5 /100 | #90 | Exceptional 39.0% |
| Spanish Americans | 99.5 /100 | #91 | Exceptional 39.0% |
| Osage | 99.4 /100 | #92 | Exceptional 39.0% |
| Blackfeet | 99.4 /100 | #93 | Exceptional 38.9% |
| Immigrants | Canada | 99.4 /100 | #94 | Exceptional 38.9% |
| Immigrants | North America | 99.4 /100 | #95 | Exceptional 38.9% |
| Latvians | 99.4 /100 | #96 | Exceptional 38.9% |
| Greeks | 99.3 /100 | #97 | Exceptional 38.9% |
| Ugandans | 99.3 /100 | #98 | Exceptional 38.9% |
| Immigrants | North Macedonia | 99.3 /100 | #99 | Exceptional 38.9% |
Demographics Similar to English by In Labor Force | Age 16-19
In terms of in labor force | age 16-19, the demographic groups most similar to English are German Russian (42.4%, a difference of 0.13%), Bangladeshi (42.5%, a difference of 0.21%), Welsh (42.3%, a difference of 0.28%), Slovak (42.6%, a difference of 0.54%), and Polish (42.1%, a difference of 0.57%).
| Demographics | Rating | Rank | In Labor Force | Age 16-19 |
| Belgians | 100.0 /100 | #19 | Exceptional 43.4% |
| Swiss | 100.0 /100 | #20 | Exceptional 43.3% |
| Ottawa | 100.0 /100 | #21 | Exceptional 43.0% |
| Sudanese | 100.0 /100 | #22 | Exceptional 42.9% |
| Slovaks | 100.0 /100 | #23 | Exceptional 42.6% |
| Bangladeshis | 100.0 /100 | #24 | Exceptional 42.5% |
| German Russians | 100.0 /100 | #25 | Exceptional 42.4% |
| English | 100.0 /100 | #26 | Exceptional 42.4% |
| Welsh | 100.0 /100 | #27 | Exceptional 42.3% |
| Poles | 100.0 /100 | #28 | Exceptional 42.1% |
| French | 100.0 /100 | #29 | Exceptional 42.1% |
| Scottish | 100.0 /100 | #30 | Exceptional 42.0% |
| Irish | 100.0 /100 | #31 | Exceptional 42.0% |
| Czechoslovakians | 100.0 /100 | #32 | Exceptional 41.9% |
| Liberians | 100.0 /100 | #33 | Exceptional 41.8% |