Osage vs Immigrants from Jamaica In Labor Force | Age 16-19
COMPARE
Osage
Immigrants from Jamaica
In Labor Force | Age 16-19
In Labor Force | Age 16-19 Comparison
Osage
Immigrants from Jamaica
39.0%
IN LABOR FORCE | AGE 16-19
99.4/ 100
METRIC RATING
92nd/ 347
METRIC RANK
32.2%
IN LABOR FORCE | AGE 16-19
0.0/ 100
METRIC RATING
307th/ 347
METRIC RANK
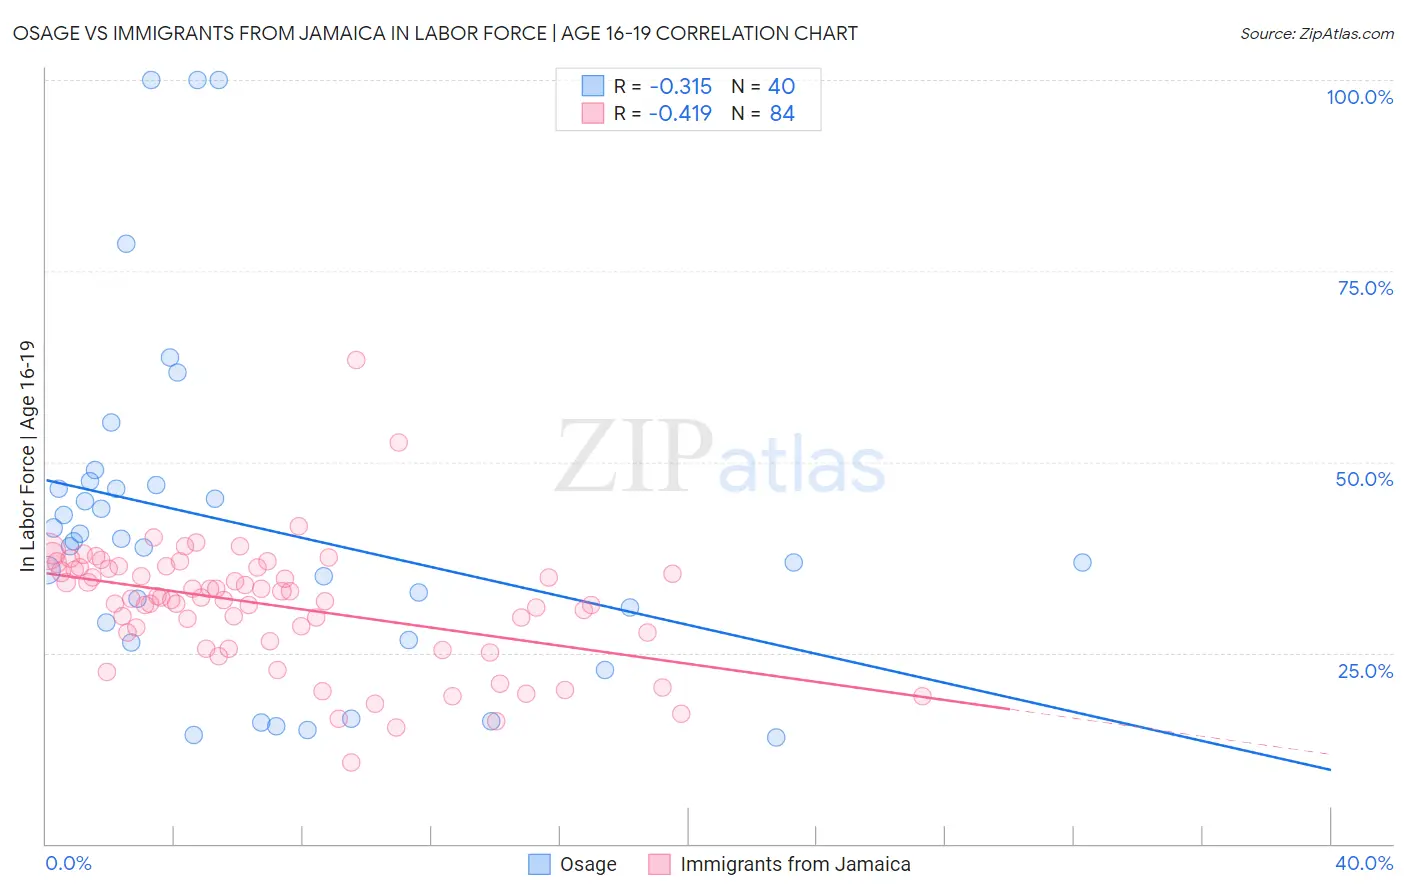
Osage vs Immigrants from Jamaica In Labor Force | Age 16-19 Correlation Chart
The statistical analysis conducted on geographies consisting of 91,776,050 people shows a mild negative correlation between the proportion of Osage and labor force participation rate among population between the ages 16 and 19 in the United States with a correlation coefficient (R) of -0.315 and weighted average of 39.0%. Similarly, the statistical analysis conducted on geographies consisting of 301,478,139 people shows a moderate negative correlation between the proportion of Immigrants from Jamaica and labor force participation rate among population between the ages 16 and 19 in the United States with a correlation coefficient (R) of -0.419 and weighted average of 32.2%, a difference of 21.0%.
In Labor Force | Age 16-19 Correlation Summary
| Measurement | Osage | Immigrants from Jamaica |
| Minimum | 13.9% | 10.6% |
| Maximum | 100.0% | 63.3% |
| Range | 86.1% | 52.7% |
| Mean | 41.6% | 31.2% |
| Median | 39.3% | 32.2% |
| Interquartile 25% (IQ1) | 27.8% | 27.0% |
| Interquartile 75% (IQ3) | 46.7% | 36.1% |
| Interquartile Range (IQR) | 19.0% | 9.0% |
| Standard Deviation (Sample) | 22.1% | 8.0% |
| Standard Deviation (Population) | 21.9% | 8.0% |
Similar Demographics by In Labor Force | Age 16-19
Demographics Similar to Osage by In Labor Force | Age 16-19
In terms of in labor force | age 16-19, the demographic groups most similar to Osage are Blackfeet (38.9%, a difference of 0.060%), Immigrants from Canada (38.9%, a difference of 0.060%), Spanish American (39.0%, a difference of 0.090%), Immigrants from North America (38.9%, a difference of 0.15%), and Latvian (38.9%, a difference of 0.18%).
| Demographics | Rating | Rank | In Labor Force | Age 16-19 |
| Creek | 99.6 /100 | #85 | Exceptional 39.1% |
| Samoans | 99.6 /100 | #86 | Exceptional 39.1% |
| Immigrants | Germany | 99.6 /100 | #87 | Exceptional 39.1% |
| Puget Sound Salish | 99.6 /100 | #88 | Exceptional 39.1% |
| Alaska Natives | 99.6 /100 | #89 | Exceptional 39.1% |
| Immigrants | Burma/Myanmar | 99.5 /100 | #90 | Exceptional 39.0% |
| Spanish Americans | 99.5 /100 | #91 | Exceptional 39.0% |
| Osage | 99.4 /100 | #92 | Exceptional 39.0% |
| Blackfeet | 99.4 /100 | #93 | Exceptional 38.9% |
| Immigrants | Canada | 99.4 /100 | #94 | Exceptional 38.9% |
| Immigrants | North America | 99.4 /100 | #95 | Exceptional 38.9% |
| Latvians | 99.4 /100 | #96 | Exceptional 38.9% |
| Greeks | 99.3 /100 | #97 | Exceptional 38.9% |
| Ugandans | 99.3 /100 | #98 | Exceptional 38.9% |
| Immigrants | North Macedonia | 99.3 /100 | #99 | Exceptional 38.9% |
Demographics Similar to Immigrants from Jamaica by In Labor Force | Age 16-19
In terms of in labor force | age 16-19, the demographic groups most similar to Immigrants from Jamaica are Navajo (32.1%, a difference of 0.35%), Spanish American Indian (32.4%, a difference of 0.49%), Immigrants from Eastern Asia (32.0%, a difference of 0.53%), Nicaraguan (32.4%, a difference of 0.62%), and Israeli (32.4%, a difference of 0.67%).
| Demographics | Rating | Rank | In Labor Force | Age 16-19 |
| Immigrants | Argentina | 0.0 /100 | #300 | Tragic 32.9% |
| Okinawans | 0.0 /100 | #301 | Tragic 32.8% |
| Belizeans | 0.0 /100 | #302 | Tragic 32.8% |
| Immigrants | Dominica | 0.0 /100 | #303 | Tragic 32.5% |
| Israelis | 0.0 /100 | #304 | Tragic 32.4% |
| Nicaraguans | 0.0 /100 | #305 | Tragic 32.4% |
| Spanish American Indians | 0.0 /100 | #306 | Tragic 32.4% |
| Immigrants | Jamaica | 0.0 /100 | #307 | Tragic 32.2% |
| Navajo | 0.0 /100 | #308 | Tragic 32.1% |
| Immigrants | Eastern Asia | 0.0 /100 | #309 | Tragic 32.0% |
| Immigrants | Iran | 0.0 /100 | #310 | Tragic 32.0% |
| Indians (Asian) | 0.0 /100 | #311 | Tragic 31.9% |
| Immigrants | Belize | 0.0 /100 | #312 | Tragic 31.8% |
| Hopi | 0.0 /100 | #313 | Tragic 31.8% |
| Cubans | 0.0 /100 | #314 | Tragic 31.8% |