Immigrants from Norway vs Croatian In Labor Force | Age 16-19
COMPARE
Immigrants from Norway
Croatian
In Labor Force | Age 16-19
In Labor Force | Age 16-19 Comparison
Immigrants from Norway
Croatians
35.9%
IN LABOR FORCE | AGE 16-19
19.8/ 100
METRIC RATING
199th/ 347
METRIC RANK
41.1%
IN LABOR FORCE | AGE 16-19
100.0/ 100
METRIC RATING
45th/ 347
METRIC RANK
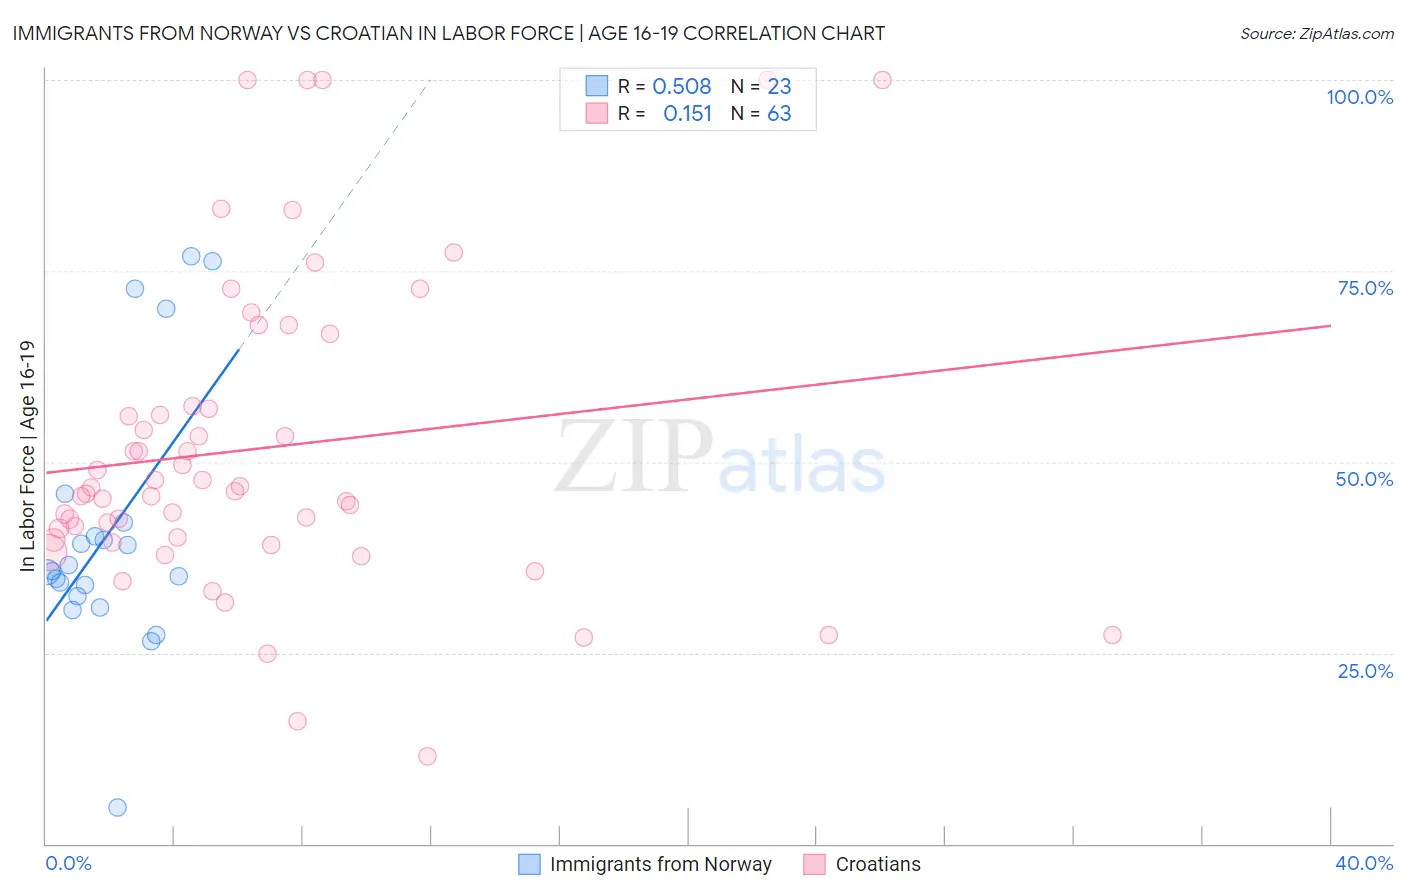
Immigrants from Norway vs Croatian In Labor Force | Age 16-19 Correlation Chart
The statistical analysis conducted on geographies consisting of 116,617,950 people shows a substantial positive correlation between the proportion of Immigrants from Norway and labor force participation rate among population between the ages 16 and 19 in the United States with a correlation coefficient (R) of 0.508 and weighted average of 35.9%. Similarly, the statistical analysis conducted on geographies consisting of 375,104,825 people shows a poor positive correlation between the proportion of Croatians and labor force participation rate among population between the ages 16 and 19 in the United States with a correlation coefficient (R) of 0.151 and weighted average of 41.1%, a difference of 14.5%.
In Labor Force | Age 16-19 Correlation Summary
| Measurement | Immigrants from Norway | Croatian |
| Minimum | 4.7% | 11.5% |
| Maximum | 76.9% | 100.0% |
| Range | 72.2% | 88.5% |
| Mean | 40.9% | 51.8% |
| Median | 35.6% | 46.2% |
| Interquartile 25% (IQ1) | 32.4% | 39.8% |
| Interquartile 75% (IQ3) | 42.0% | 57.3% |
| Interquartile Range (IQR) | 9.6% | 17.4% |
| Standard Deviation (Sample) | 17.4% | 20.4% |
| Standard Deviation (Population) | 17.0% | 20.3% |
Similar Demographics by In Labor Force | Age 16-19
Demographics Similar to Immigrants from Norway by In Labor Force | Age 16-19
In terms of in labor force | age 16-19, the demographic groups most similar to Immigrants from Norway are Immigrants from Northern Africa (35.9%, a difference of 0.010%), Immigrants from Sweden (35.9%, a difference of 0.080%), Immigrants from Serbia (36.0%, a difference of 0.090%), Mexican American Indian (36.0%, a difference of 0.10%), and Alsatian (35.9%, a difference of 0.19%).
| Demographics | Rating | Rank | In Labor Force | Age 16-19 |
| Afghans | 25.7 /100 | #192 | Fair 36.1% |
| Immigrants | Denmark | 25.0 /100 | #193 | Fair 36.1% |
| Nigerians | 24.6 /100 | #194 | Fair 36.1% |
| Bolivians | 23.3 /100 | #195 | Fair 36.0% |
| Mexican American Indians | 21.1 /100 | #196 | Fair 36.0% |
| Immigrants | Serbia | 21.0 /100 | #197 | Fair 36.0% |
| Immigrants | Northern Africa | 19.9 /100 | #198 | Poor 35.9% |
| Immigrants | Norway | 19.8 /100 | #199 | Poor 35.9% |
| Immigrants | Sweden | 18.8 /100 | #200 | Poor 35.9% |
| Alsatians | 17.5 /100 | #201 | Poor 35.9% |
| Senegalese | 17.4 /100 | #202 | Poor 35.9% |
| Immigrants | Nigeria | 16.8 /100 | #203 | Poor 35.8% |
| Immigrants | Albania | 15.0 /100 | #204 | Poor 35.8% |
| South American Indians | 14.6 /100 | #205 | Poor 35.8% |
| Chileans | 14.6 /100 | #206 | Poor 35.8% |
Demographics Similar to Croatians by In Labor Force | Age 16-19
In terms of in labor force | age 16-19, the demographic groups most similar to Croatians are European (41.1%, a difference of 0.040%), Tongan (41.2%, a difference of 0.14%), Immigrants from Sudan (41.0%, a difference of 0.32%), Celtic (41.3%, a difference of 0.45%), and White/Caucasian (41.3%, a difference of 0.45%).
| Demographics | Rating | Rank | In Labor Force | Age 16-19 |
| Sioux | 100.0 /100 | #38 | Exceptional 41.5% |
| Scotch-Irish | 100.0 /100 | #39 | Exceptional 41.5% |
| Immigrants | Liberia | 100.0 /100 | #40 | Exceptional 41.5% |
| Celtics | 100.0 /100 | #41 | Exceptional 41.3% |
| Whites/Caucasians | 100.0 /100 | #42 | Exceptional 41.3% |
| Tongans | 100.0 /100 | #43 | Exceptional 41.2% |
| Europeans | 100.0 /100 | #44 | Exceptional 41.1% |
| Croatians | 100.0 /100 | #45 | Exceptional 41.1% |
| Immigrants | Sudan | 100.0 /100 | #46 | Exceptional 41.0% |
| Carpatho Rusyns | 100.0 /100 | #47 | Exceptional 40.8% |
| Icelanders | 100.0 /100 | #48 | Exceptional 40.8% |
| Cree | 100.0 /100 | #49 | Exceptional 40.8% |
| Indonesians | 100.0 /100 | #50 | Exceptional 40.7% |
| Immigrants | Zaire | 100.0 /100 | #51 | Exceptional 40.7% |
| Immigrants | Laos | 100.0 /100 | #52 | Exceptional 40.6% |