Osage vs Immigrants from Latin America In Labor Force | Age 16-19
COMPARE
Osage
Immigrants from Latin America
In Labor Force | Age 16-19
In Labor Force | Age 16-19 Comparison
Osage
Immigrants from Latin America
39.0%
IN LABOR FORCE | AGE 16-19
99.4/ 100
METRIC RATING
92nd/ 347
METRIC RANK
33.9%
IN LABOR FORCE | AGE 16-19
0.3/ 100
METRIC RATING
276th/ 347
METRIC RANK
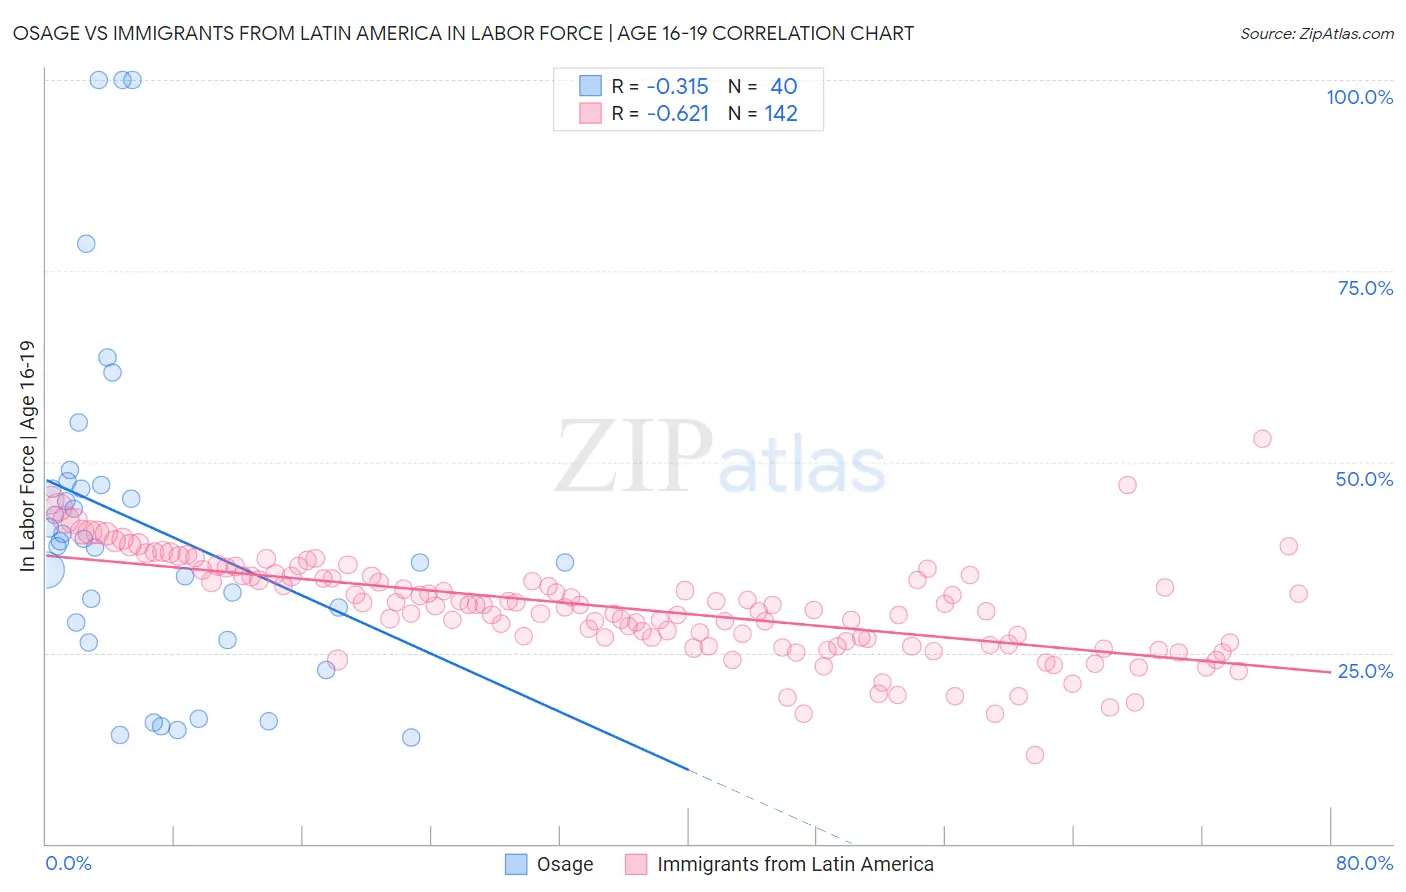
Osage vs Immigrants from Latin America In Labor Force | Age 16-19 Correlation Chart
The statistical analysis conducted on geographies consisting of 91,776,050 people shows a mild negative correlation between the proportion of Osage and labor force participation rate among population between the ages 16 and 19 in the United States with a correlation coefficient (R) of -0.315 and weighted average of 39.0%. Similarly, the statistical analysis conducted on geographies consisting of 555,360,667 people shows a significant negative correlation between the proportion of Immigrants from Latin America and labor force participation rate among population between the ages 16 and 19 in the United States with a correlation coefficient (R) of -0.621 and weighted average of 33.9%, a difference of 14.9%.
In Labor Force | Age 16-19 Correlation Summary
| Measurement | Osage | Immigrants from Latin America |
| Minimum | 13.9% | 11.7% |
| Maximum | 100.0% | 53.1% |
| Range | 86.1% | 41.4% |
| Mean | 41.6% | 30.8% |
| Median | 39.3% | 31.2% |
| Interquartile 25% (IQ1) | 27.8% | 26.1% |
| Interquartile 75% (IQ3) | 46.7% | 35.0% |
| Interquartile Range (IQR) | 19.0% | 8.9% |
| Standard Deviation (Sample) | 22.1% | 6.6% |
| Standard Deviation (Population) | 21.9% | 6.6% |
Similar Demographics by In Labor Force | Age 16-19
Demographics Similar to Osage by In Labor Force | Age 16-19
In terms of in labor force | age 16-19, the demographic groups most similar to Osage are Blackfeet (38.9%, a difference of 0.060%), Immigrants from Canada (38.9%, a difference of 0.060%), Spanish American (39.0%, a difference of 0.090%), Immigrants from North America (38.9%, a difference of 0.15%), and Latvian (38.9%, a difference of 0.18%).
| Demographics | Rating | Rank | In Labor Force | Age 16-19 |
| Creek | 99.6 /100 | #85 | Exceptional 39.1% |
| Samoans | 99.6 /100 | #86 | Exceptional 39.1% |
| Immigrants | Germany | 99.6 /100 | #87 | Exceptional 39.1% |
| Puget Sound Salish | 99.6 /100 | #88 | Exceptional 39.1% |
| Alaska Natives | 99.6 /100 | #89 | Exceptional 39.1% |
| Immigrants | Burma/Myanmar | 99.5 /100 | #90 | Exceptional 39.0% |
| Spanish Americans | 99.5 /100 | #91 | Exceptional 39.0% |
| Osage | 99.4 /100 | #92 | Exceptional 39.0% |
| Blackfeet | 99.4 /100 | #93 | Exceptional 38.9% |
| Immigrants | Canada | 99.4 /100 | #94 | Exceptional 38.9% |
| Immigrants | North America | 99.4 /100 | #95 | Exceptional 38.9% |
| Latvians | 99.4 /100 | #96 | Exceptional 38.9% |
| Greeks | 99.3 /100 | #97 | Exceptional 38.9% |
| Ugandans | 99.3 /100 | #98 | Exceptional 38.9% |
| Immigrants | North Macedonia | 99.3 /100 | #99 | Exceptional 38.9% |
Demographics Similar to Immigrants from Latin America by In Labor Force | Age 16-19
In terms of in labor force | age 16-19, the demographic groups most similar to Immigrants from Latin America are Immigrants from Fiji (33.9%, a difference of 0.10%), Menominee (33.9%, a difference of 0.11%), Colombian (33.8%, a difference of 0.18%), Venezuelan (34.0%, a difference of 0.20%), and Paraguayan (33.8%, a difference of 0.20%).
| Demographics | Rating | Rank | In Labor Force | Age 16-19 |
| Pima | 0.5 /100 | #269 | Tragic 34.1% |
| Immigrants | Russia | 0.4 /100 | #270 | Tragic 34.1% |
| Central American Indians | 0.4 /100 | #271 | Tragic 34.1% |
| Asians | 0.4 /100 | #272 | Tragic 34.1% |
| Immigrants | Panama | 0.4 /100 | #273 | Tragic 34.0% |
| Venezuelans | 0.3 /100 | #274 | Tragic 34.0% |
| Immigrants | Fiji | 0.3 /100 | #275 | Tragic 33.9% |
| Immigrants | Latin America | 0.3 /100 | #276 | Tragic 33.9% |
| Menominee | 0.3 /100 | #277 | Tragic 33.9% |
| Colombians | 0.3 /100 | #278 | Tragic 33.8% |
| Paraguayans | 0.3 /100 | #279 | Tragic 33.8% |
| Taiwanese | 0.3 /100 | #280 | Tragic 33.8% |
| Cypriots | 0.3 /100 | #281 | Tragic 33.8% |
| Immigrants | Korea | 0.3 /100 | #282 | Tragic 33.8% |
| Immigrants | Venezuela | 0.2 /100 | #283 | Tragic 33.7% |