Syrian vs Croatian In Labor Force | Age 16-19
COMPARE
Syrian
Croatian
In Labor Force | Age 16-19
In Labor Force | Age 16-19 Comparison
Syrians
Croatians
37.6%
IN LABOR FORCE | AGE 16-19
90.7/ 100
METRIC RATING
141st/ 347
METRIC RANK
41.1%
IN LABOR FORCE | AGE 16-19
100.0/ 100
METRIC RATING
45th/ 347
METRIC RANK
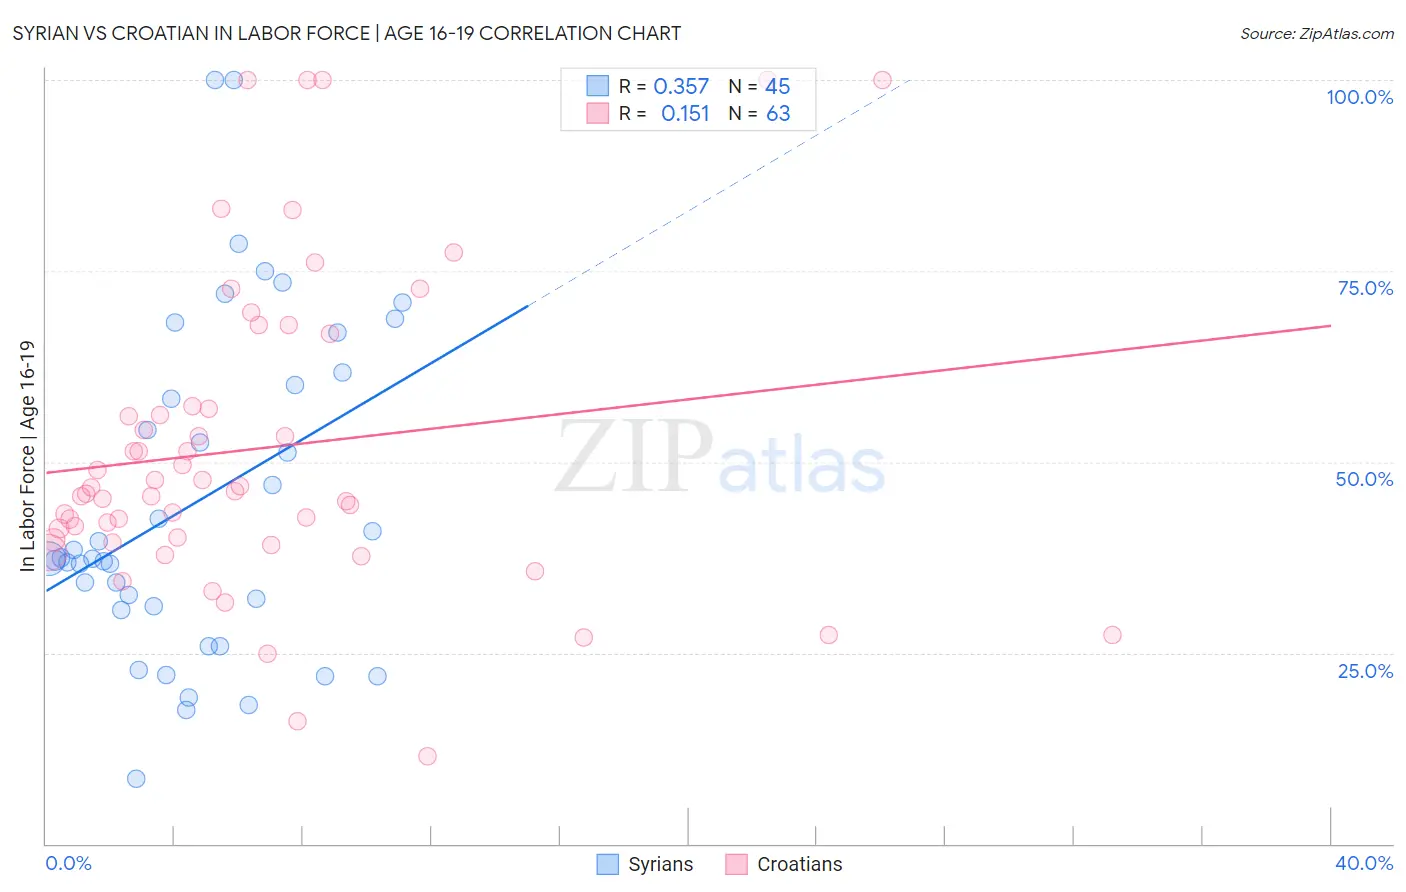
Syrian vs Croatian In Labor Force | Age 16-19 Correlation Chart
The statistical analysis conducted on geographies consisting of 266,042,941 people shows a mild positive correlation between the proportion of Syrians and labor force participation rate among population between the ages 16 and 19 in the United States with a correlation coefficient (R) of 0.357 and weighted average of 37.6%. Similarly, the statistical analysis conducted on geographies consisting of 375,104,825 people shows a poor positive correlation between the proportion of Croatians and labor force participation rate among population between the ages 16 and 19 in the United States with a correlation coefficient (R) of 0.151 and weighted average of 41.1%, a difference of 9.3%.
In Labor Force | Age 16-19 Correlation Summary
| Measurement | Syrian | Croatian |
| Minimum | 8.6% | 11.5% |
| Maximum | 100.0% | 100.0% |
| Range | 91.4% | 88.5% |
| Mean | 44.8% | 51.8% |
| Median | 37.3% | 46.2% |
| Interquartile 25% (IQ1) | 30.9% | 39.8% |
| Interquartile 75% (IQ3) | 60.9% | 57.3% |
| Interquartile Range (IQR) | 30.0% | 17.4% |
| Standard Deviation (Sample) | 21.6% | 20.4% |
| Standard Deviation (Population) | 21.4% | 20.3% |
Similar Demographics by In Labor Force | Age 16-19
Demographics Similar to Syrians by In Labor Force | Age 16-19
In terms of in labor force | age 16-19, the demographic groups most similar to Syrians are Estonian (37.7%, a difference of 0.14%), Sierra Leonean (37.6%, a difference of 0.15%), Immigrants from Moldova (37.7%, a difference of 0.17%), Pakistani (37.6%, a difference of 0.18%), and Comanche (37.7%, a difference of 0.19%).
| Demographics | Rating | Rank | In Labor Force | Age 16-19 |
| Immigrants | Netherlands | 93.7 /100 | #134 | Exceptional 37.8% |
| Macedonians | 93.4 /100 | #135 | Exceptional 37.8% |
| Australians | 93.2 /100 | #136 | Exceptional 37.8% |
| Cajuns | 93.2 /100 | #137 | Exceptional 37.8% |
| Comanche | 91.9 /100 | #138 | Exceptional 37.7% |
| Immigrants | Moldova | 91.9 /100 | #139 | Exceptional 37.7% |
| Estonians | 91.7 /100 | #140 | Exceptional 37.7% |
| Syrians | 90.7 /100 | #141 | Exceptional 37.6% |
| Sierra Leoneans | 89.7 /100 | #142 | Excellent 37.6% |
| Pakistanis | 89.5 /100 | #143 | Excellent 37.6% |
| Japanese | 89.3 /100 | #144 | Excellent 37.5% |
| Paiute | 89.3 /100 | #145 | Excellent 37.5% |
| Immigrants | Western Europe | 88.9 /100 | #146 | Excellent 37.5% |
| Brazilians | 88.7 /100 | #147 | Excellent 37.5% |
| Romanians | 87.3 /100 | #148 | Excellent 37.5% |
Demographics Similar to Croatians by In Labor Force | Age 16-19
In terms of in labor force | age 16-19, the demographic groups most similar to Croatians are European (41.1%, a difference of 0.040%), Tongan (41.2%, a difference of 0.14%), Immigrants from Sudan (41.0%, a difference of 0.32%), Celtic (41.3%, a difference of 0.45%), and White/Caucasian (41.3%, a difference of 0.45%).
| Demographics | Rating | Rank | In Labor Force | Age 16-19 |
| Sioux | 100.0 /100 | #38 | Exceptional 41.5% |
| Scotch-Irish | 100.0 /100 | #39 | Exceptional 41.5% |
| Immigrants | Liberia | 100.0 /100 | #40 | Exceptional 41.5% |
| Celtics | 100.0 /100 | #41 | Exceptional 41.3% |
| Whites/Caucasians | 100.0 /100 | #42 | Exceptional 41.3% |
| Tongans | 100.0 /100 | #43 | Exceptional 41.2% |
| Europeans | 100.0 /100 | #44 | Exceptional 41.1% |
| Croatians | 100.0 /100 | #45 | Exceptional 41.1% |
| Immigrants | Sudan | 100.0 /100 | #46 | Exceptional 41.0% |
| Carpatho Rusyns | 100.0 /100 | #47 | Exceptional 40.8% |
| Icelanders | 100.0 /100 | #48 | Exceptional 40.8% |
| Cree | 100.0 /100 | #49 | Exceptional 40.8% |
| Indonesians | 100.0 /100 | #50 | Exceptional 40.7% |
| Immigrants | Zaire | 100.0 /100 | #51 | Exceptional 40.7% |
| Immigrants | Laos | 100.0 /100 | #52 | Exceptional 40.6% |