Laotian vs Croatian In Labor Force | Age 16-19
COMPARE
Laotian
Croatian
In Labor Force | Age 16-19
In Labor Force | Age 16-19 Comparison
Laotians
Croatians
34.9%
IN LABOR FORCE | AGE 16-19
2.4/ 100
METRIC RATING
247th/ 347
METRIC RANK
41.1%
IN LABOR FORCE | AGE 16-19
100.0/ 100
METRIC RATING
45th/ 347
METRIC RANK
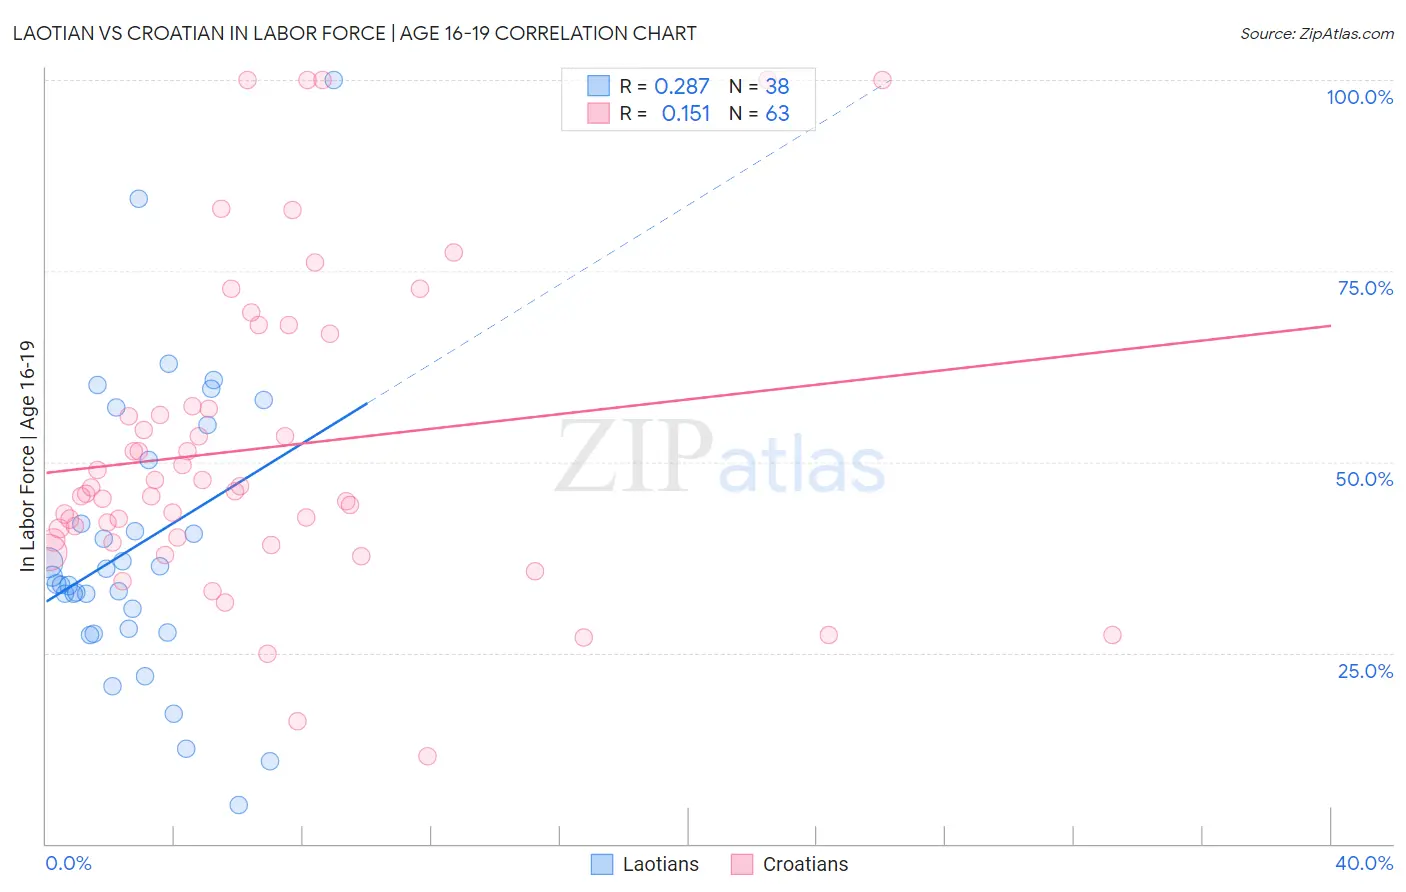
Laotian vs Croatian In Labor Force | Age 16-19 Correlation Chart
The statistical analysis conducted on geographies consisting of 224,669,771 people shows a weak positive correlation between the proportion of Laotians and labor force participation rate among population between the ages 16 and 19 in the United States with a correlation coefficient (R) of 0.287 and weighted average of 34.9%. Similarly, the statistical analysis conducted on geographies consisting of 375,104,825 people shows a poor positive correlation between the proportion of Croatians and labor force participation rate among population between the ages 16 and 19 in the United States with a correlation coefficient (R) of 0.151 and weighted average of 41.1%, a difference of 18.0%.
In Labor Force | Age 16-19 Correlation Summary
| Measurement | Laotian | Croatian |
| Minimum | 5.1% | 11.5% |
| Maximum | 100.0% | 100.0% |
| Range | 94.9% | 88.5% |
| Mean | 39.1% | 51.8% |
| Median | 34.5% | 46.2% |
| Interquartile 25% (IQ1) | 28.1% | 39.8% |
| Interquartile 75% (IQ3) | 50.3% | 57.3% |
| Interquartile Range (IQR) | 22.2% | 17.4% |
| Standard Deviation (Sample) | 19.0% | 20.4% |
| Standard Deviation (Population) | 18.8% | 20.3% |
Similar Demographics by In Labor Force | Age 16-19
Demographics Similar to Laotians by In Labor Force | Age 16-19
In terms of in labor force | age 16-19, the demographic groups most similar to Laotians are Immigrants from Sri Lanka (34.9%, a difference of 0.010%), Immigrants from Greece (34.9%, a difference of 0.030%), Immigrants from Turkey (34.9%, a difference of 0.090%), Central American (34.8%, a difference of 0.090%), and Pueblo (34.9%, a difference of 0.11%).
| Demographics | Rating | Rank | In Labor Force | Age 16-19 |
| Immigrants | Central America | 3.0 /100 | #240 | Tragic 35.0% |
| Immigrants | Ireland | 2.9 /100 | #241 | Tragic 35.0% |
| Uruguayans | 2.6 /100 | #242 | Tragic 34.9% |
| Pueblo | 2.6 /100 | #243 | Tragic 34.9% |
| Immigrants | Turkey | 2.6 /100 | #244 | Tragic 34.9% |
| Immigrants | Greece | 2.4 /100 | #245 | Tragic 34.9% |
| Immigrants | Sri Lanka | 2.4 /100 | #246 | Tragic 34.9% |
| Laotians | 2.4 /100 | #247 | Tragic 34.9% |
| Central Americans | 2.2 /100 | #248 | Tragic 34.8% |
| Immigrants | Ukraine | 2.2 /100 | #249 | Tragic 34.8% |
| Immigrants | Pakistan | 2.0 /100 | #250 | Tragic 34.8% |
| Immigrants | Western Asia | 2.0 /100 | #251 | Tragic 34.8% |
| Immigrants | Chile | 2.0 /100 | #252 | Tragic 34.8% |
| Immigrants | Japan | 1.5 /100 | #253 | Tragic 34.7% |
| Bahamians | 1.4 /100 | #254 | Tragic 34.6% |
Demographics Similar to Croatians by In Labor Force | Age 16-19
In terms of in labor force | age 16-19, the demographic groups most similar to Croatians are European (41.1%, a difference of 0.040%), Tongan (41.2%, a difference of 0.14%), Immigrants from Sudan (41.0%, a difference of 0.32%), Celtic (41.3%, a difference of 0.45%), and White/Caucasian (41.3%, a difference of 0.45%).
| Demographics | Rating | Rank | In Labor Force | Age 16-19 |
| Sioux | 100.0 /100 | #38 | Exceptional 41.5% |
| Scotch-Irish | 100.0 /100 | #39 | Exceptional 41.5% |
| Immigrants | Liberia | 100.0 /100 | #40 | Exceptional 41.5% |
| Celtics | 100.0 /100 | #41 | Exceptional 41.3% |
| Whites/Caucasians | 100.0 /100 | #42 | Exceptional 41.3% |
| Tongans | 100.0 /100 | #43 | Exceptional 41.2% |
| Europeans | 100.0 /100 | #44 | Exceptional 41.1% |
| Croatians | 100.0 /100 | #45 | Exceptional 41.1% |
| Immigrants | Sudan | 100.0 /100 | #46 | Exceptional 41.0% |
| Carpatho Rusyns | 100.0 /100 | #47 | Exceptional 40.8% |
| Icelanders | 100.0 /100 | #48 | Exceptional 40.8% |
| Cree | 100.0 /100 | #49 | Exceptional 40.8% |
| Indonesians | 100.0 /100 | #50 | Exceptional 40.7% |
| Immigrants | Zaire | 100.0 /100 | #51 | Exceptional 40.7% |
| Immigrants | Laos | 100.0 /100 | #52 | Exceptional 40.6% |