Menominee vs Swiss In Labor Force | Age 20-64
COMPARE
Menominee
Swiss
In Labor Force | Age 20-64
In Labor Force | Age 20-64 Comparison
Menominee
Swiss
75.3%
IN LABOR FORCE | AGE 20-64
0.0/ 100
METRIC RATING
325th/ 347
METRIC RANK
79.4%
IN LABOR FORCE | AGE 20-64
28.9/ 100
METRIC RATING
191st/ 347
METRIC RANK
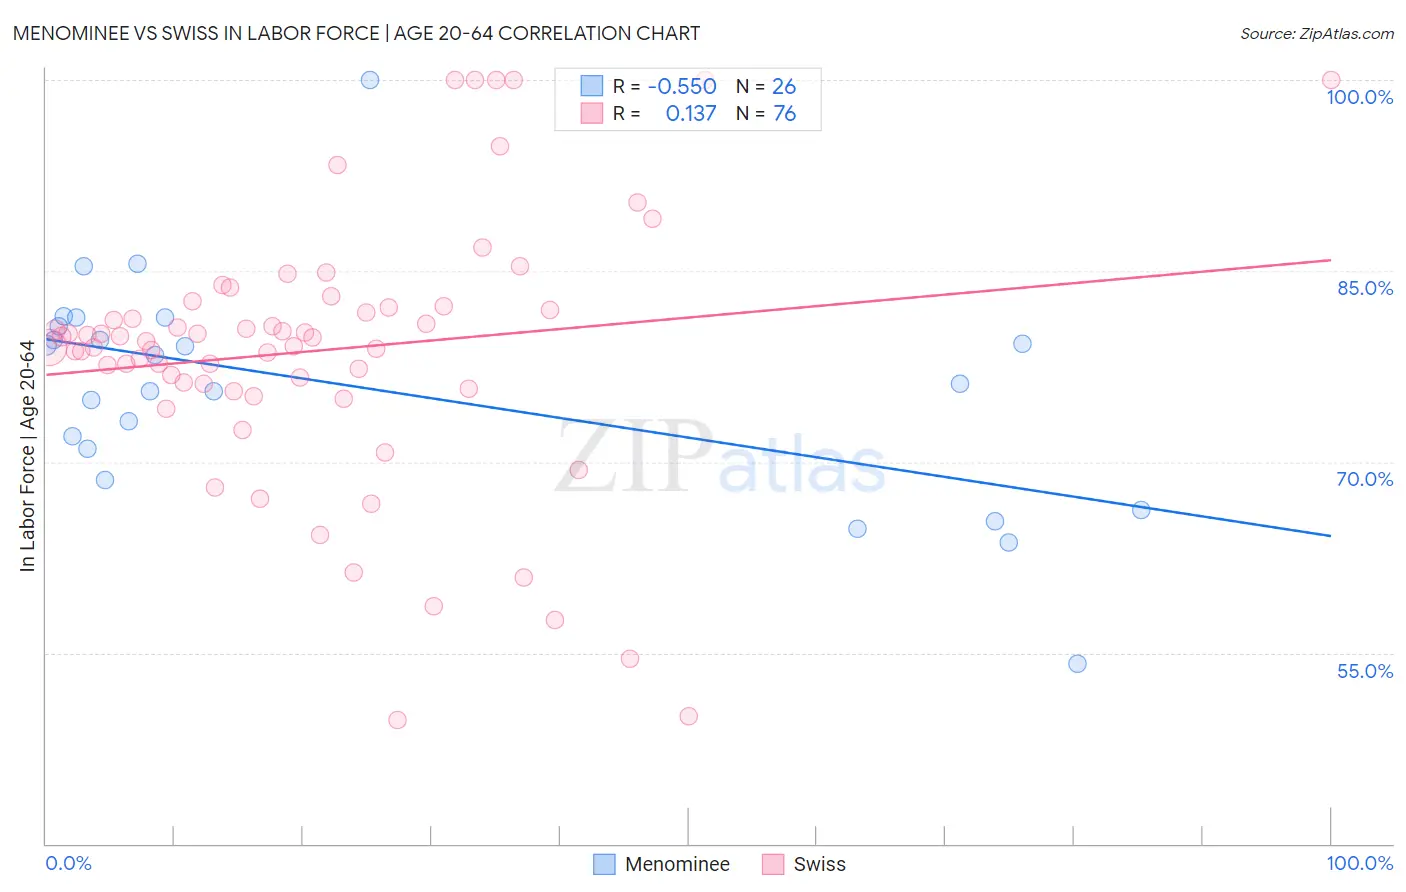
Menominee vs Swiss In Labor Force | Age 20-64 Correlation Chart
The statistical analysis conducted on geographies consisting of 45,777,849 people shows a substantial negative correlation between the proportion of Menominee and labor force participation rate among population between the ages 20 and 64 in the United States with a correlation coefficient (R) of -0.550 and weighted average of 75.3%. Similarly, the statistical analysis conducted on geographies consisting of 465,041,286 people shows a poor positive correlation between the proportion of Swiss and labor force participation rate among population between the ages 20 and 64 in the United States with a correlation coefficient (R) of 0.137 and weighted average of 79.4%, a difference of 5.5%.
In Labor Force | Age 20-64 Correlation Summary
| Measurement | Menominee | Swiss |
| Minimum | 54.1% | 49.7% |
| Maximum | 100.0% | 100.0% |
| Range | 45.9% | 50.3% |
| Mean | 75.8% | 78.8% |
| Median | 77.2% | 79.6% |
| Interquartile 25% (IQ1) | 71.0% | 76.0% |
| Interquartile 75% (IQ3) | 80.7% | 82.2% |
| Interquartile Range (IQR) | 9.7% | 6.2% |
| Standard Deviation (Sample) | 8.9% | 10.6% |
| Standard Deviation (Population) | 8.8% | 10.5% |
Similar Demographics by In Labor Force | Age 20-64
Demographics Similar to Menominee by In Labor Force | Age 20-64
In terms of in labor force | age 20-64, the demographic groups most similar to Menominee are Choctaw (75.4%, a difference of 0.14%), Cajun (75.5%, a difference of 0.19%), Creek (75.1%, a difference of 0.22%), Dutch West Indian (75.5%, a difference of 0.23%), and Seminole (75.5%, a difference of 0.28%).
| Demographics | Rating | Rank | In Labor Force | Age 20-64 |
| Chickasaw | 0.0 /100 | #318 | Tragic 76.2% |
| Inupiat | 0.0 /100 | #319 | Tragic 76.1% |
| Yakama | 0.0 /100 | #320 | Tragic 75.8% |
| Seminole | 0.0 /100 | #321 | Tragic 75.5% |
| Dutch West Indians | 0.0 /100 | #322 | Tragic 75.5% |
| Cajuns | 0.0 /100 | #323 | Tragic 75.5% |
| Choctaw | 0.0 /100 | #324 | Tragic 75.4% |
| Menominee | 0.0 /100 | #325 | Tragic 75.3% |
| Creek | 0.0 /100 | #326 | Tragic 75.1% |
| Sioux | 0.0 /100 | #327 | Tragic 75.0% |
| Kiowa | 0.0 /100 | #328 | Tragic 75.0% |
| Cheyenne | 0.0 /100 | #329 | Tragic 74.8% |
| Colville | 0.0 /100 | #330 | Tragic 74.8% |
| Paiute | 0.0 /100 | #331 | Tragic 74.7% |
| Arapaho | 0.0 /100 | #332 | Tragic 74.4% |
Demographics Similar to Swiss by In Labor Force | Age 20-64
In terms of in labor force | age 20-64, the demographic groups most similar to Swiss are Immigrants from El Salvador (79.4%, a difference of 0.020%), Immigrants from Syria (79.4%, a difference of 0.020%), Immigrants from Denmark (79.4%, a difference of 0.020%), Immigrants from Haiti (79.4%, a difference of 0.030%), and Indonesian (79.4%, a difference of 0.030%).
| Demographics | Rating | Rank | In Labor Force | Age 20-64 |
| Finns | 35.9 /100 | #184 | Fair 79.5% |
| Israelis | 34.7 /100 | #185 | Fair 79.5% |
| Northern Europeans | 34.5 /100 | #186 | Fair 79.5% |
| Assyrians/Chaldeans/Syriacs | 33.3 /100 | #187 | Fair 79.4% |
| Immigrants | Haiti | 32.1 /100 | #188 | Fair 79.4% |
| Immigrants | El Salvador | 30.9 /100 | #189 | Fair 79.4% |
| Immigrants | Syria | 30.8 /100 | #190 | Fair 79.4% |
| Swiss | 28.9 /100 | #191 | Fair 79.4% |
| Immigrants | Denmark | 26.9 /100 | #192 | Fair 79.4% |
| Indonesians | 26.1 /100 | #193 | Fair 79.4% |
| Immigrants | Thailand | 24.8 /100 | #194 | Fair 79.4% |
| Immigrants | Austria | 23.7 /100 | #195 | Fair 79.4% |
| Ecuadorians | 23.1 /100 | #196 | Fair 79.4% |
| Immigrants | Senegal | 22.5 /100 | #197 | Fair 79.4% |
| Immigrants | Laos | 21.5 /100 | #198 | Fair 79.4% |