Menominee vs Alaska Native In Labor Force | Age 20-64
COMPARE
Menominee
Alaska Native
In Labor Force | Age 20-64
In Labor Force | Age 20-64 Comparison
Menominee
Alaska Natives
75.3%
IN LABOR FORCE | AGE 20-64
0.0/ 100
METRIC RATING
325th/ 347
METRIC RANK
77.0%
IN LABOR FORCE | AGE 20-64
0.0/ 100
METRIC RATING
308th/ 347
METRIC RANK
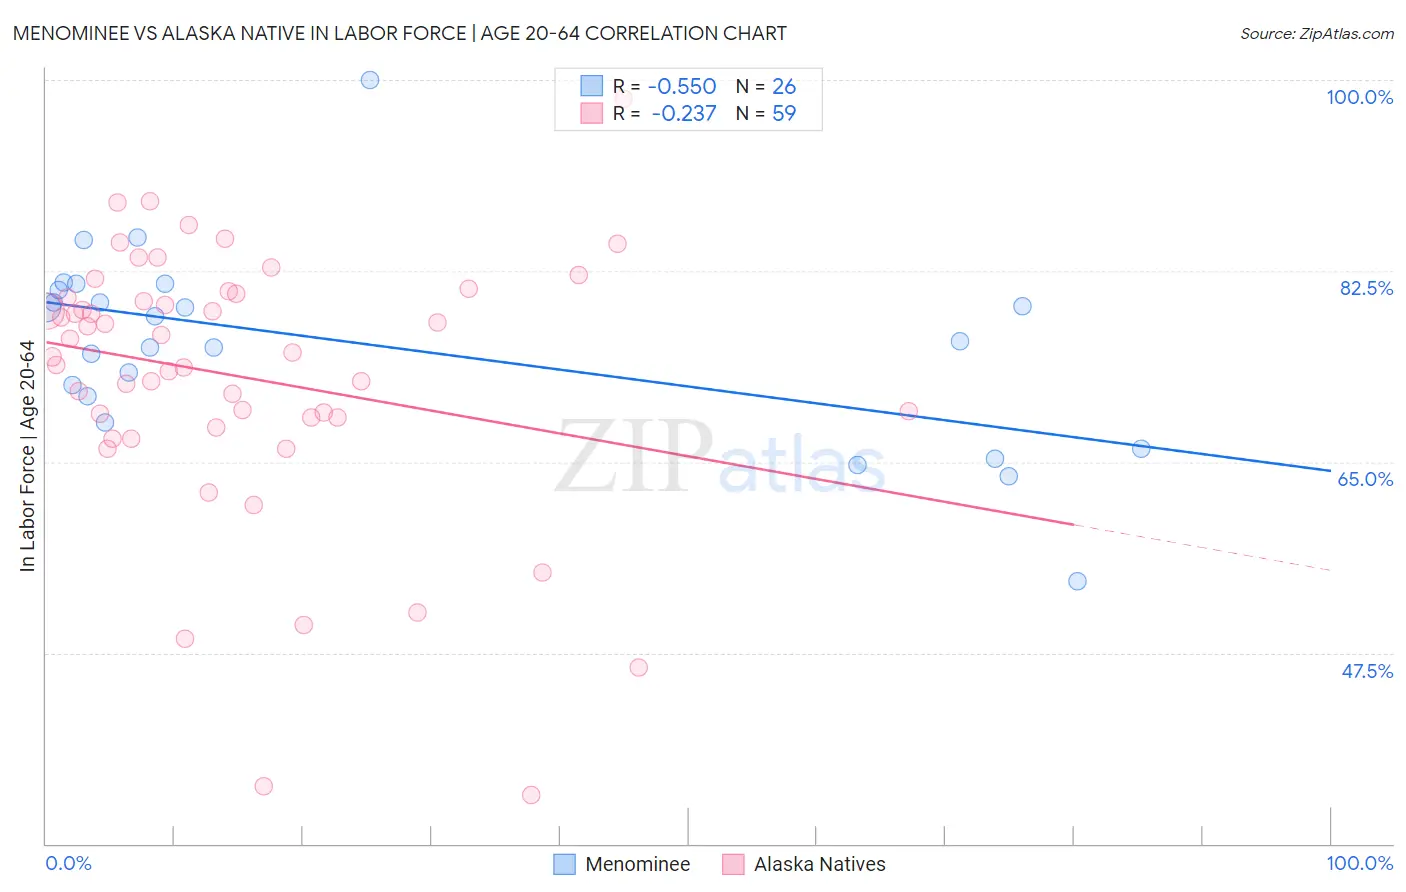
Menominee vs Alaska Native In Labor Force | Age 20-64 Correlation Chart
The statistical analysis conducted on geographies consisting of 45,777,849 people shows a substantial negative correlation between the proportion of Menominee and labor force participation rate among population between the ages 20 and 64 in the United States with a correlation coefficient (R) of -0.550 and weighted average of 75.3%. Similarly, the statistical analysis conducted on geographies consisting of 76,778,887 people shows a weak negative correlation between the proportion of Alaska Natives and labor force participation rate among population between the ages 20 and 64 in the United States with a correlation coefficient (R) of -0.237 and weighted average of 77.0%, a difference of 2.3%.
In Labor Force | Age 20-64 Correlation Summary
| Measurement | Menominee | Alaska Native |
| Minimum | 54.1% | 34.5% |
| Maximum | 100.0% | 98.3% |
| Range | 45.9% | 63.8% |
| Mean | 75.8% | 72.8% |
| Median | 77.2% | 75.0% |
| Interquartile 25% (IQ1) | 71.0% | 69.1% |
| Interquartile 75% (IQ3) | 80.7% | 80.4% |
| Interquartile Range (IQR) | 9.7% | 11.3% |
| Standard Deviation (Sample) | 8.9% | 12.4% |
| Standard Deviation (Population) | 8.8% | 12.3% |
Demographics Similar to Menominee and Alaska Natives by In Labor Force | Age 20-64
In terms of in labor force | age 20-64, the demographic groups most similar to Menominee are Choctaw (75.4%, a difference of 0.14%), Cajun (75.5%, a difference of 0.19%), Creek (75.1%, a difference of 0.22%), Dutch West Indian (75.5%, a difference of 0.23%), and Seminole (75.5%, a difference of 0.28%). Similarly, the demographic groups most similar to Alaska Natives are American (77.0%, a difference of 0.010%), Comanche (77.0%, a difference of 0.020%), Central American Indian (77.1%, a difference of 0.060%), Blackfeet (77.0%, a difference of 0.060%), and Potawatomi (77.2%, a difference of 0.23%).
| Demographics | Rating | Rank | In Labor Force | Age 20-64 |
| Potawatomi | 0.0 /100 | #306 | Tragic 77.2% |
| Central American Indians | 0.0 /100 | #307 | Tragic 77.1% |
| Alaska Natives | 0.0 /100 | #308 | Tragic 77.0% |
| Americans | 0.0 /100 | #309 | Tragic 77.0% |
| Comanche | 0.0 /100 | #310 | Tragic 77.0% |
| Blackfeet | 0.0 /100 | #311 | Tragic 77.0% |
| Alaskan Athabascans | 0.0 /100 | #312 | Tragic 76.9% |
| Shoshone | 0.0 /100 | #313 | Tragic 76.8% |
| Blacks/African Americans | 0.0 /100 | #314 | Tragic 76.8% |
| Ottawa | 0.0 /100 | #315 | Tragic 76.7% |
| Yaqui | 0.0 /100 | #316 | Tragic 76.5% |
| Cherokee | 0.0 /100 | #317 | Tragic 76.2% |
| Chickasaw | 0.0 /100 | #318 | Tragic 76.2% |
| Inupiat | 0.0 /100 | #319 | Tragic 76.1% |
| Yakama | 0.0 /100 | #320 | Tragic 75.8% |
| Seminole | 0.0 /100 | #321 | Tragic 75.5% |
| Dutch West Indians | 0.0 /100 | #322 | Tragic 75.5% |
| Cajuns | 0.0 /100 | #323 | Tragic 75.5% |
| Choctaw | 0.0 /100 | #324 | Tragic 75.4% |
| Menominee | 0.0 /100 | #325 | Tragic 75.3% |
| Creek | 0.0 /100 | #326 | Tragic 75.1% |