Menominee vs Spanish In Labor Force | Age 20-64
COMPARE
Menominee
Spanish
In Labor Force | Age 20-64
In Labor Force | Age 20-64 Comparison
Menominee
Spanish
75.3%
IN LABOR FORCE | AGE 20-64
0.0/ 100
METRIC RATING
325th/ 347
METRIC RANK
78.2%
IN LABOR FORCE | AGE 20-64
0.0/ 100
METRIC RATING
275th/ 347
METRIC RANK
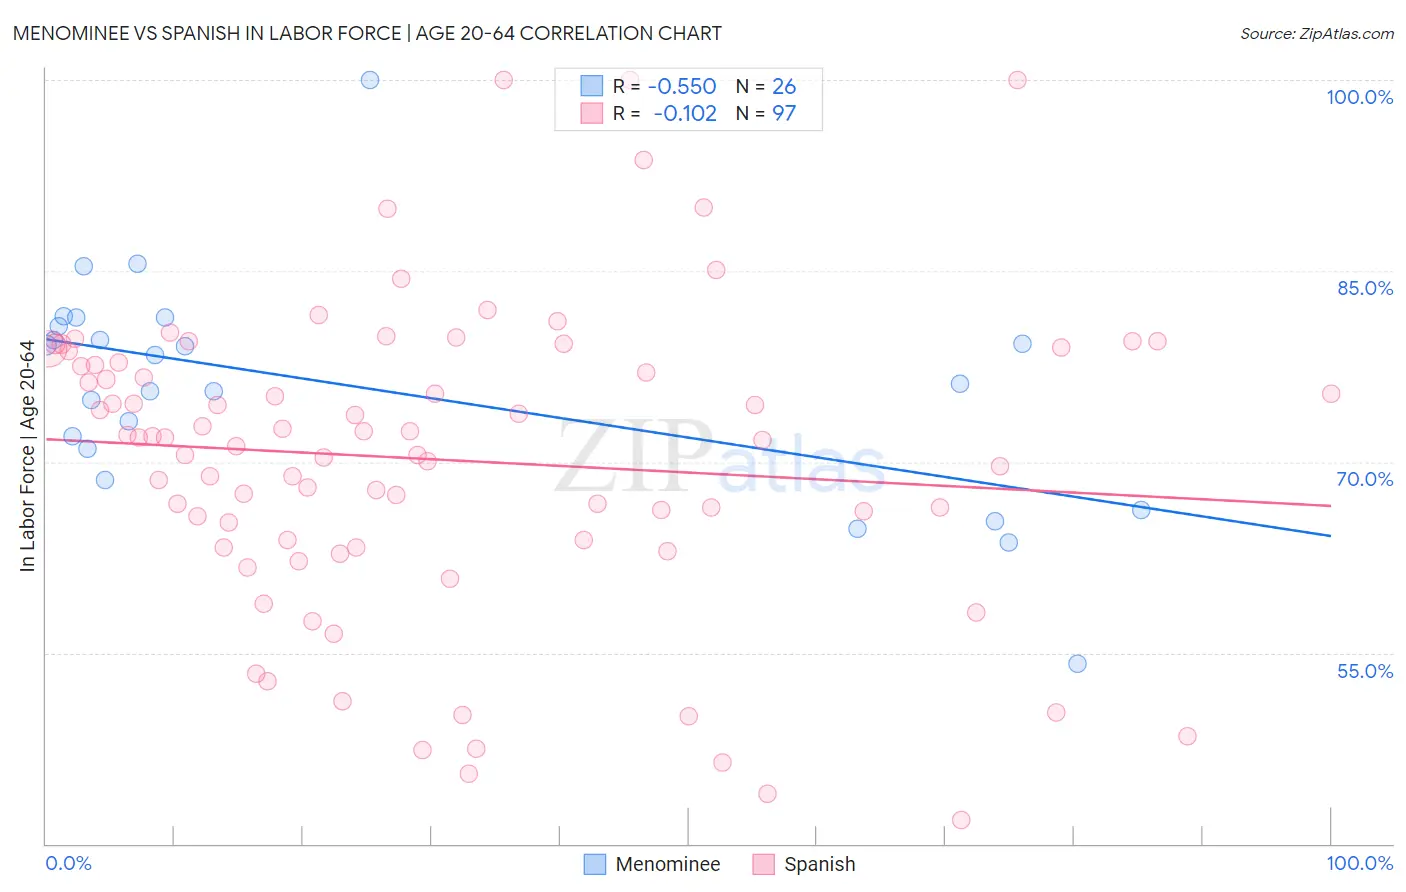
Menominee vs Spanish In Labor Force | Age 20-64 Correlation Chart
The statistical analysis conducted on geographies consisting of 45,777,849 people shows a substantial negative correlation between the proportion of Menominee and labor force participation rate among population between the ages 20 and 64 in the United States with a correlation coefficient (R) of -0.550 and weighted average of 75.3%. Similarly, the statistical analysis conducted on geographies consisting of 422,183,269 people shows a poor negative correlation between the proportion of Spanish and labor force participation rate among population between the ages 20 and 64 in the United States with a correlation coefficient (R) of -0.102 and weighted average of 78.2%, a difference of 3.8%.
In Labor Force | Age 20-64 Correlation Summary
| Measurement | Menominee | Spanish |
| Minimum | 54.1% | 41.9% |
| Maximum | 100.0% | 100.0% |
| Range | 45.9% | 58.1% |
| Mean | 75.8% | 70.2% |
| Median | 77.2% | 71.9% |
| Interquartile 25% (IQ1) | 71.0% | 63.6% |
| Interquartile 75% (IQ3) | 80.7% | 78.2% |
| Interquartile Range (IQR) | 9.7% | 14.7% |
| Standard Deviation (Sample) | 8.9% | 12.1% |
| Standard Deviation (Population) | 8.8% | 12.1% |
Similar Demographics by In Labor Force | Age 20-64
Demographics Similar to Menominee by In Labor Force | Age 20-64
In terms of in labor force | age 20-64, the demographic groups most similar to Menominee are Choctaw (75.4%, a difference of 0.14%), Cajun (75.5%, a difference of 0.19%), Creek (75.1%, a difference of 0.22%), Dutch West Indian (75.5%, a difference of 0.23%), and Seminole (75.5%, a difference of 0.28%).
| Demographics | Rating | Rank | In Labor Force | Age 20-64 |
| Chickasaw | 0.0 /100 | #318 | Tragic 76.2% |
| Inupiat | 0.0 /100 | #319 | Tragic 76.1% |
| Yakama | 0.0 /100 | #320 | Tragic 75.8% |
| Seminole | 0.0 /100 | #321 | Tragic 75.5% |
| Dutch West Indians | 0.0 /100 | #322 | Tragic 75.5% |
| Cajuns | 0.0 /100 | #323 | Tragic 75.5% |
| Choctaw | 0.0 /100 | #324 | Tragic 75.4% |
| Menominee | 0.0 /100 | #325 | Tragic 75.3% |
| Creek | 0.0 /100 | #326 | Tragic 75.1% |
| Sioux | 0.0 /100 | #327 | Tragic 75.0% |
| Kiowa | 0.0 /100 | #328 | Tragic 75.0% |
| Cheyenne | 0.0 /100 | #329 | Tragic 74.8% |
| Colville | 0.0 /100 | #330 | Tragic 74.8% |
| Paiute | 0.0 /100 | #331 | Tragic 74.7% |
| Arapaho | 0.0 /100 | #332 | Tragic 74.4% |
Demographics Similar to Spanish by In Labor Force | Age 20-64
In terms of in labor force | age 20-64, the demographic groups most similar to Spanish are Puget Sound Salish (78.2%, a difference of 0.0%), Aleut (78.2%, a difference of 0.010%), Immigrants from Bahamas (78.2%, a difference of 0.020%), Mexican American Indian (78.2%, a difference of 0.020%), and French American Indian (78.2%, a difference of 0.030%).
| Demographics | Rating | Rank | In Labor Force | Age 20-64 |
| West Indians | 0.0 /100 | #268 | Tragic 78.3% |
| Immigrants | Barbados | 0.0 /100 | #269 | Tragic 78.3% |
| Scotch-Irish | 0.0 /100 | #270 | Tragic 78.3% |
| Immigrants | Latin America | 0.0 /100 | #271 | Tragic 78.3% |
| Marshallese | 0.0 /100 | #272 | Tragic 78.3% |
| French American Indians | 0.0 /100 | #273 | Tragic 78.2% |
| Aleuts | 0.0 /100 | #274 | Tragic 78.2% |
| Spanish | 0.0 /100 | #275 | Tragic 78.2% |
| Puget Sound Salish | 0.0 /100 | #276 | Tragic 78.2% |
| Immigrants | Bahamas | 0.0 /100 | #277 | Tragic 78.2% |
| Mexican American Indians | 0.0 /100 | #278 | Tragic 78.2% |
| Belizeans | 0.0 /100 | #279 | Tragic 78.2% |
| Immigrants | Dominica | 0.0 /100 | #280 | Tragic 78.1% |
| Guyanese | 0.0 /100 | #281 | Tragic 78.1% |
| Immigrants | St. Vincent and the Grenadines | 0.0 /100 | #282 | Tragic 78.1% |