Hispanic or Latino vs Panamanian In Labor Force | Age 20-64
COMPARE
Hispanic or Latino
Panamanian
In Labor Force | Age 20-64
In Labor Force | Age 20-64 Comparison
Hispanics or Latinos
Panamanians
77.6%
IN LABOR FORCE | AGE 20-64
0.0/ 100
METRIC RATING
299th/ 347
METRIC RANK
79.1%
IN LABOR FORCE | AGE 20-64
5.7/ 100
METRIC RATING
228th/ 347
METRIC RANK
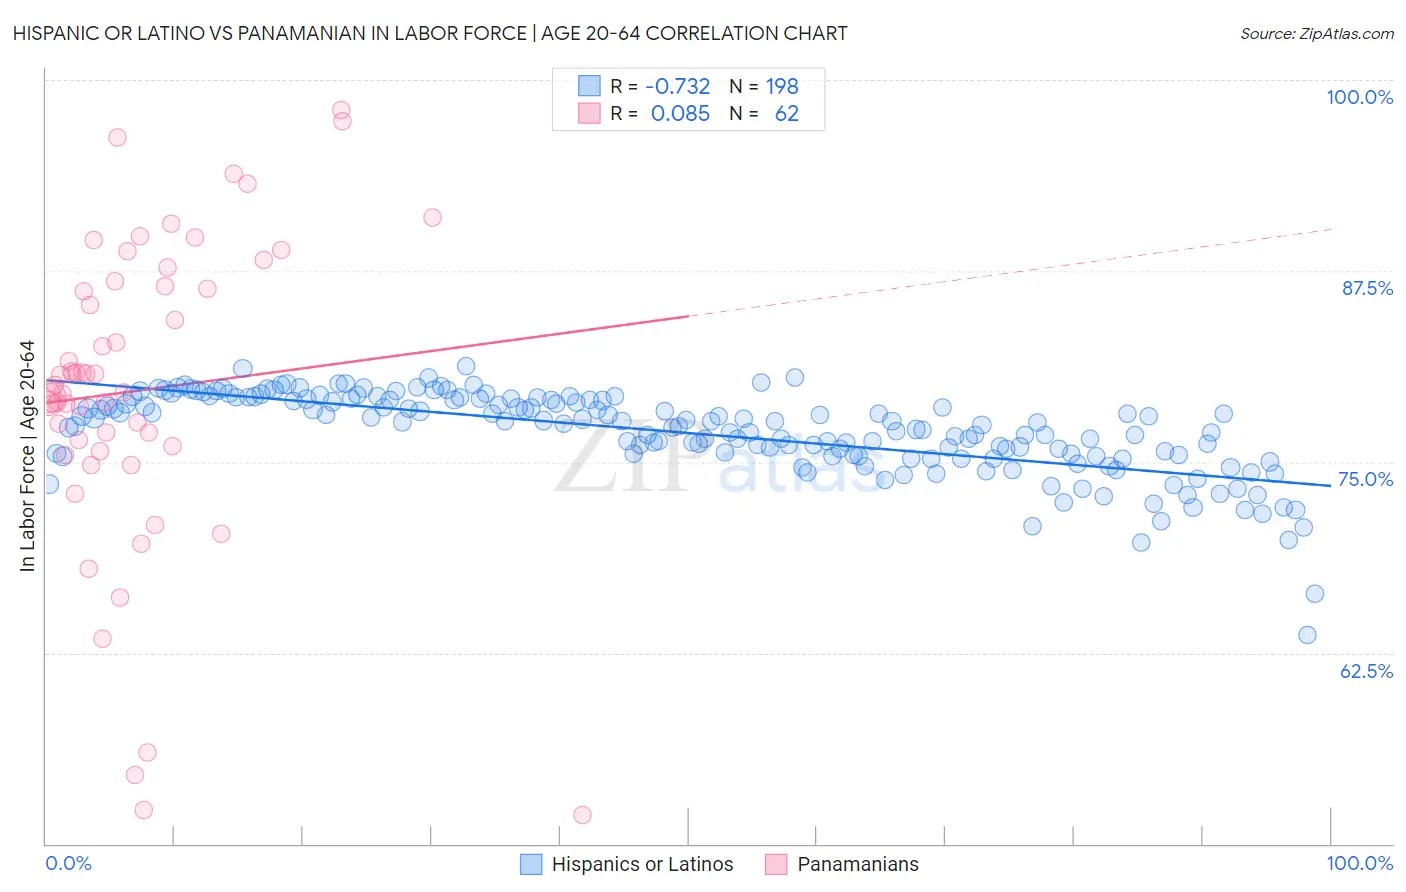
Hispanic or Latino vs Panamanian In Labor Force | Age 20-64 Correlation Chart
The statistical analysis conducted on geographies consisting of 575,448,606 people shows a strong negative correlation between the proportion of Hispanics or Latinos and labor force participation rate among population between the ages 20 and 64 in the United States with a correlation coefficient (R) of -0.732 and weighted average of 77.6%. Similarly, the statistical analysis conducted on geographies consisting of 281,243,301 people shows a slight positive correlation between the proportion of Panamanians and labor force participation rate among population between the ages 20 and 64 in the United States with a correlation coefficient (R) of 0.085 and weighted average of 79.1%, a difference of 1.9%.
In Labor Force | Age 20-64 Correlation Summary
| Measurement | Hispanic or Latino | Panamanian |
| Minimum | 63.7% | 51.9% |
| Maximum | 81.2% | 98.0% |
| Range | 17.6% | 46.1% |
| Mean | 76.9% | 79.7% |
| Median | 77.6% | 79.8% |
| Interquartile 25% (IQ1) | 75.4% | 76.0% |
| Interquartile 75% (IQ3) | 79.1% | 86.5% |
| Interquartile Range (IQR) | 3.7% | 10.5% |
| Standard Deviation (Sample) | 2.7% | 10.1% |
| Standard Deviation (Population) | 2.7% | 10.0% |
Similar Demographics by In Labor Force | Age 20-64
Demographics Similar to Hispanics or Latinos by In Labor Force | Age 20-64
In terms of in labor force | age 20-64, the demographic groups most similar to Hispanics or Latinos are Cree (77.7%, a difference of 0.060%), Immigrants from Dominican Republic (77.7%, a difference of 0.070%), Dominican (77.7%, a difference of 0.070%), Spanish American Indian (77.6%, a difference of 0.070%), and Immigrants from Grenada (77.7%, a difference of 0.11%).
| Demographics | Rating | Rank | In Labor Force | Age 20-64 |
| Immigrants | Azores | 0.0 /100 | #292 | Tragic 77.8% |
| Delaware | 0.0 /100 | #293 | Tragic 77.8% |
| Immigrants | Central America | 0.0 /100 | #294 | Tragic 77.7% |
| Immigrants | Grenada | 0.0 /100 | #295 | Tragic 77.7% |
| Immigrants | Dominican Republic | 0.0 /100 | #296 | Tragic 77.7% |
| Dominicans | 0.0 /100 | #297 | Tragic 77.7% |
| Cree | 0.0 /100 | #298 | Tragic 77.7% |
| Hispanics or Latinos | 0.0 /100 | #299 | Tragic 77.6% |
| Spanish American Indians | 0.0 /100 | #300 | Tragic 77.6% |
| Nepalese | 0.0 /100 | #301 | Tragic 77.5% |
| Iroquois | 0.0 /100 | #302 | Tragic 77.5% |
| Chippewa | 0.0 /100 | #303 | Tragic 77.3% |
| Immigrants | Mexico | 0.0 /100 | #304 | Tragic 77.3% |
| Mexicans | 0.0 /100 | #305 | Tragic 77.2% |
| Potawatomi | 0.0 /100 | #306 | Tragic 77.2% |
Demographics Similar to Panamanians by In Labor Force | Age 20-64
In terms of in labor force | age 20-64, the demographic groups most similar to Panamanians are Alsatian (79.1%, a difference of 0.0%), Native Hawaiian (79.1%, a difference of 0.0%), Central American (79.1%, a difference of 0.010%), Immigrants from Western Europe (79.1%, a difference of 0.010%), and Portuguese (79.1%, a difference of 0.020%).
| Demographics | Rating | Rank | In Labor Force | Age 20-64 |
| Hungarians | 7.2 /100 | #221 | Tragic 79.2% |
| Immigrants | Panama | 6.9 /100 | #222 | Tragic 79.1% |
| Canadians | 6.8 /100 | #223 | Tragic 79.1% |
| Immigrants | Uzbekistan | 6.8 /100 | #224 | Tragic 79.1% |
| Portuguese | 6.4 /100 | #225 | Tragic 79.1% |
| Central Americans | 5.9 /100 | #226 | Tragic 79.1% |
| Immigrants | Western Europe | 5.9 /100 | #227 | Tragic 79.1% |
| Panamanians | 5.7 /100 | #228 | Tragic 79.1% |
| Alsatians | 5.7 /100 | #229 | Tragic 79.1% |
| Native Hawaiians | 5.6 /100 | #230 | Tragic 79.1% |
| Lebanese | 5.1 /100 | #231 | Tragic 79.1% |
| Guamanians/Chamorros | 4.5 /100 | #232 | Tragic 79.1% |
| Japanese | 4.0 /100 | #233 | Tragic 79.1% |
| Immigrants | Canada | 3.2 /100 | #234 | Tragic 79.0% |
| Tlingit-Haida | 3.2 /100 | #235 | Tragic 79.0% |