Immigrants from Greece vs Panamanian In Labor Force | Age 20-64
COMPARE
Immigrants from Greece
Panamanian
In Labor Force | Age 20-64
In Labor Force | Age 20-64 Comparison
Immigrants from Greece
Panamanians
80.4%
IN LABOR FORCE | AGE 20-64
99.4/ 100
METRIC RATING
49th/ 347
METRIC RANK
79.1%
IN LABOR FORCE | AGE 20-64
5.7/ 100
METRIC RATING
228th/ 347
METRIC RANK
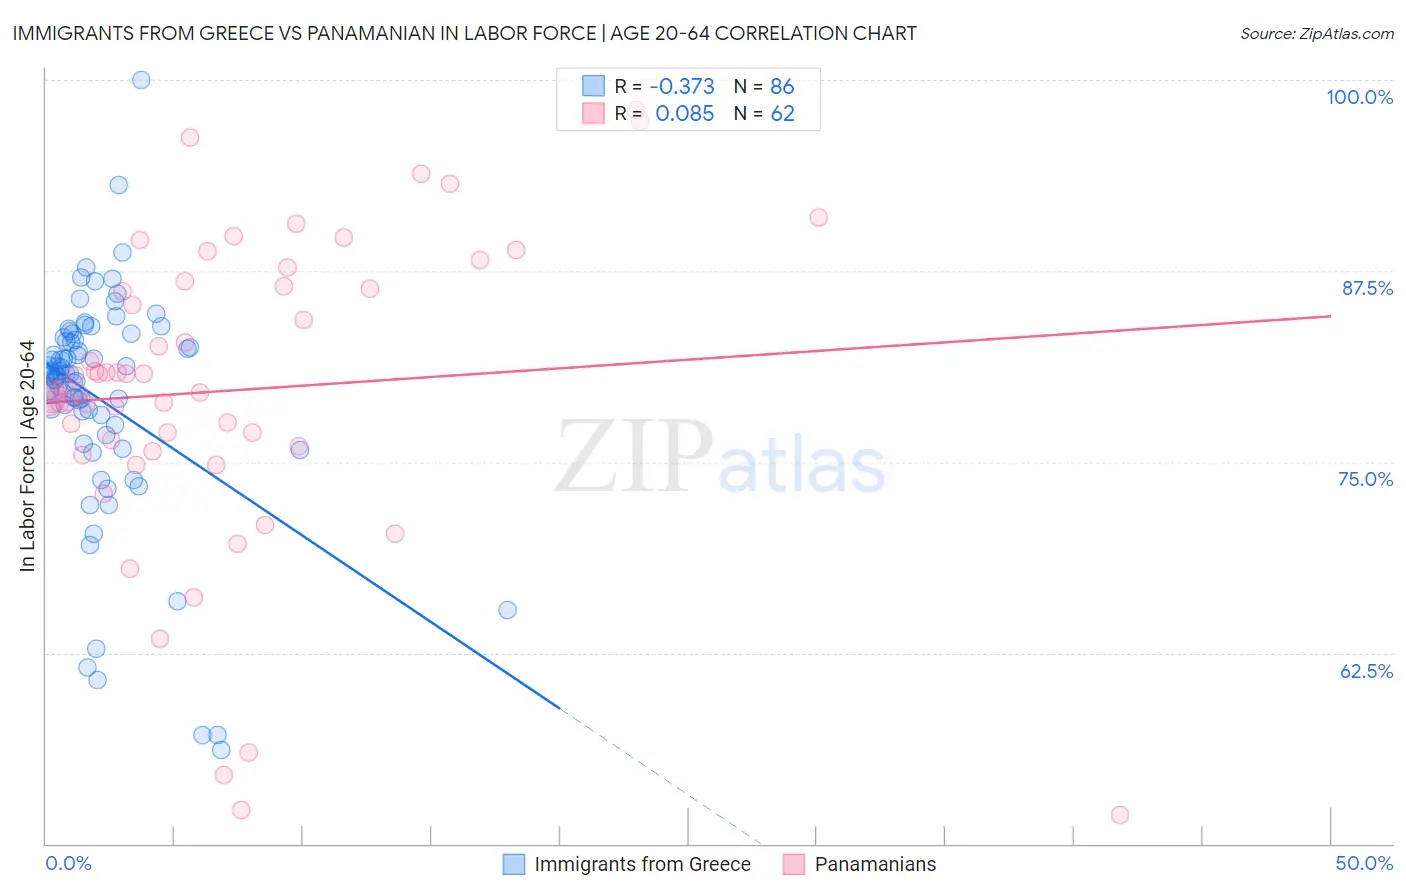
Immigrants from Greece vs Panamanian In Labor Force | Age 20-64 Correlation Chart
The statistical analysis conducted on geographies consisting of 216,878,258 people shows a mild negative correlation between the proportion of Immigrants from Greece and labor force participation rate among population between the ages 20 and 64 in the United States with a correlation coefficient (R) of -0.373 and weighted average of 80.4%. Similarly, the statistical analysis conducted on geographies consisting of 281,243,301 people shows a slight positive correlation between the proportion of Panamanians and labor force participation rate among population between the ages 20 and 64 in the United States with a correlation coefficient (R) of 0.085 and weighted average of 79.1%, a difference of 1.6%.
In Labor Force | Age 20-64 Correlation Summary
| Measurement | Immigrants from Greece | Panamanian |
| Minimum | 56.1% | 51.9% |
| Maximum | 100.0% | 98.0% |
| Range | 43.9% | 46.1% |
| Mean | 79.1% | 79.7% |
| Median | 80.7% | 79.8% |
| Interquartile 25% (IQ1) | 77.4% | 76.0% |
| Interquartile 75% (IQ3) | 83.0% | 86.5% |
| Interquartile Range (IQR) | 5.6% | 10.5% |
| Standard Deviation (Sample) | 7.5% | 10.1% |
| Standard Deviation (Population) | 7.4% | 10.0% |
Similar Demographics by In Labor Force | Age 20-64
Demographics Similar to Immigrants from Greece by In Labor Force | Age 20-64
In terms of in labor force | age 20-64, the demographic groups most similar to Immigrants from Greece are Immigrants from Sudan (80.4%, a difference of 0.020%), Immigrants from Hong Kong (80.4%, a difference of 0.040%), Immigrants from Sri Lanka (80.4%, a difference of 0.040%), Immigrants from Africa (80.4%, a difference of 0.060%), and Turkish (80.3%, a difference of 0.060%).
| Demographics | Rating | Rank | In Labor Force | Age 20-64 |
| Latvians | 99.8 /100 | #42 | Exceptional 80.5% |
| Czechs | 99.7 /100 | #43 | Exceptional 80.5% |
| Immigrants | Middle Africa | 99.7 /100 | #44 | Exceptional 80.5% |
| Slovenes | 99.7 /100 | #45 | Exceptional 80.5% |
| Immigrants | Pakistan | 99.6 /100 | #46 | Exceptional 80.5% |
| Immigrants | Africa | 99.6 /100 | #47 | Exceptional 80.4% |
| Immigrants | Hong Kong | 99.5 /100 | #48 | Exceptional 80.4% |
| Immigrants | Greece | 99.4 /100 | #49 | Exceptional 80.4% |
| Immigrants | Sudan | 99.4 /100 | #50 | Exceptional 80.4% |
| Immigrants | Sri Lanka | 99.3 /100 | #51 | Exceptional 80.4% |
| Turks | 99.2 /100 | #52 | Exceptional 80.3% |
| Immigrants | Peru | 99.2 /100 | #53 | Exceptional 80.3% |
| Peruvians | 99.1 /100 | #54 | Exceptional 80.3% |
| Immigrants | Cabo Verde | 99.0 /100 | #55 | Exceptional 80.3% |
| Immigrants | Northern Africa | 99.0 /100 | #56 | Exceptional 80.3% |
Demographics Similar to Panamanians by In Labor Force | Age 20-64
In terms of in labor force | age 20-64, the demographic groups most similar to Panamanians are Alsatian (79.1%, a difference of 0.0%), Native Hawaiian (79.1%, a difference of 0.0%), Central American (79.1%, a difference of 0.010%), Immigrants from Western Europe (79.1%, a difference of 0.010%), and Portuguese (79.1%, a difference of 0.020%).
| Demographics | Rating | Rank | In Labor Force | Age 20-64 |
| Hungarians | 7.2 /100 | #221 | Tragic 79.2% |
| Immigrants | Panama | 6.9 /100 | #222 | Tragic 79.1% |
| Canadians | 6.8 /100 | #223 | Tragic 79.1% |
| Immigrants | Uzbekistan | 6.8 /100 | #224 | Tragic 79.1% |
| Portuguese | 6.4 /100 | #225 | Tragic 79.1% |
| Central Americans | 5.9 /100 | #226 | Tragic 79.1% |
| Immigrants | Western Europe | 5.9 /100 | #227 | Tragic 79.1% |
| Panamanians | 5.7 /100 | #228 | Tragic 79.1% |
| Alsatians | 5.7 /100 | #229 | Tragic 79.1% |
| Native Hawaiians | 5.6 /100 | #230 | Tragic 79.1% |
| Lebanese | 5.1 /100 | #231 | Tragic 79.1% |
| Guamanians/Chamorros | 4.5 /100 | #232 | Tragic 79.1% |
| Japanese | 4.0 /100 | #233 | Tragic 79.1% |
| Immigrants | Canada | 3.2 /100 | #234 | Tragic 79.0% |
| Tlingit-Haida | 3.2 /100 | #235 | Tragic 79.0% |