Immigrants from Romania vs Native Hawaiian In Labor Force | Age > 16
COMPARE
Immigrants from Romania
Native Hawaiian
In Labor Force | Age > 16
In Labor Force | Age > 16 Comparison
Immigrants from Romania
Native Hawaiians
65.5%
IN LABOR FORCE | AGE > 16
88.6/ 100
METRIC RATING
144th/ 347
METRIC RANK
64.1%
IN LABOR FORCE | AGE > 16
0.3/ 100
METRIC RATING
272nd/ 347
METRIC RANK
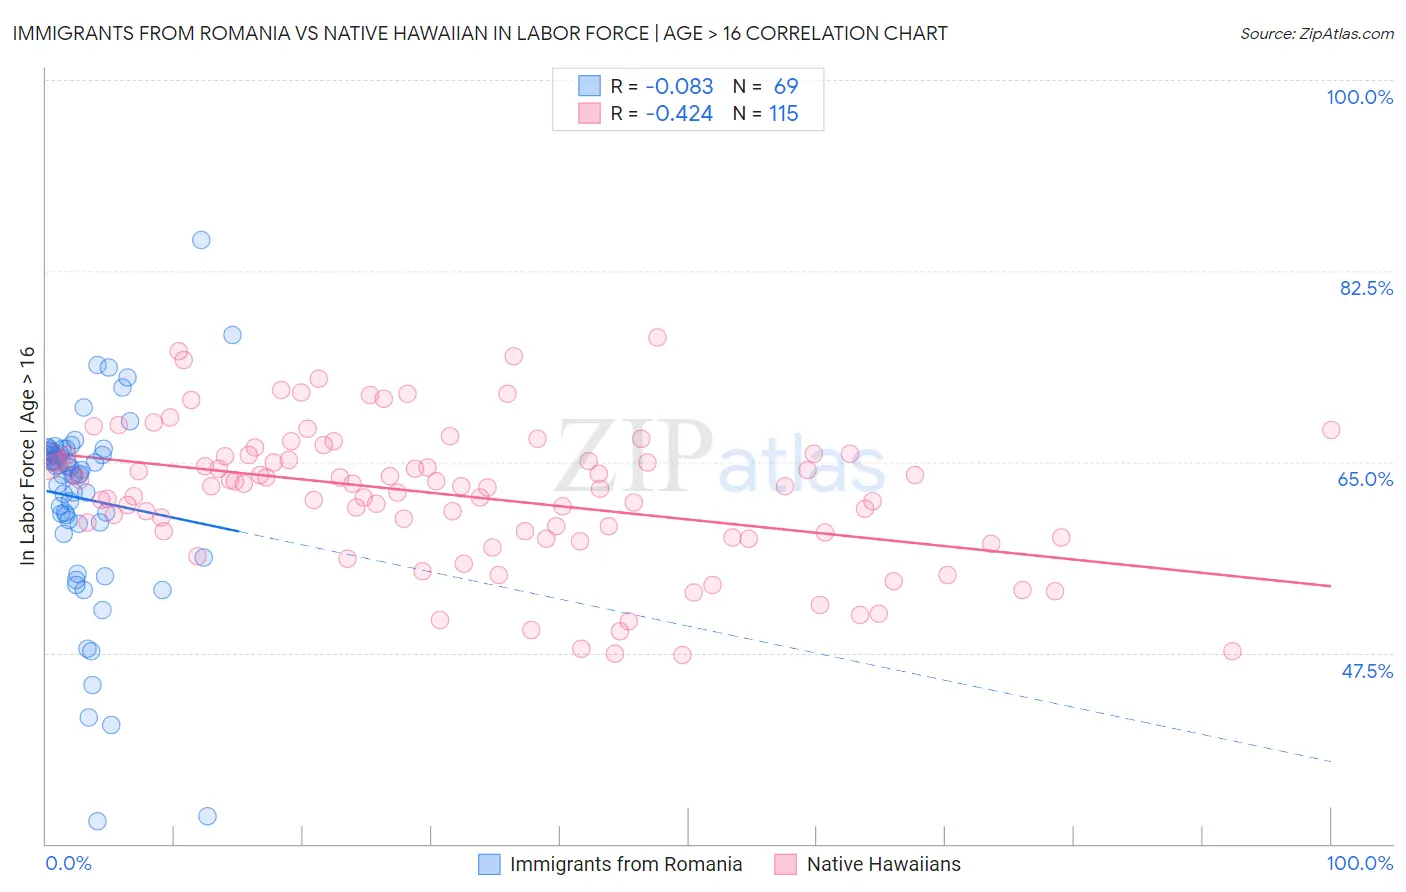
Immigrants from Romania vs Native Hawaiian In Labor Force | Age > 16 Correlation Chart
The statistical analysis conducted on geographies consisting of 257,014,238 people shows a slight negative correlation between the proportion of Immigrants from Romania and labor force participation rate among population ages 16 and over in the United States with a correlation coefficient (R) of -0.083 and weighted average of 65.5%. Similarly, the statistical analysis conducted on geographies consisting of 332,118,603 people shows a moderate negative correlation between the proportion of Native Hawaiians and labor force participation rate among population ages 16 and over in the United States with a correlation coefficient (R) of -0.424 and weighted average of 64.1%, a difference of 2.2%.
In Labor Force | Age > 16 Correlation Summary
| Measurement | Immigrants from Romania | Native Hawaiian |
| Minimum | 32.1% | 47.3% |
| Maximum | 85.3% | 76.4% |
| Range | 53.2% | 29.1% |
| Mean | 61.6% | 61.9% |
| Median | 64.3% | 62.8% |
| Interquartile 25% (IQ1) | 59.4% | 58.1% |
| Interquartile 75% (IQ3) | 66.0% | 65.6% |
| Interquartile Range (IQR) | 6.6% | 7.5% |
| Standard Deviation (Sample) | 9.1% | 6.3% |
| Standard Deviation (Population) | 9.0% | 6.3% |
Similar Demographics by In Labor Force | Age > 16
Demographics Similar to Immigrants from Romania by In Labor Force | Age > 16
In terms of in labor force | age > 16, the demographic groups most similar to Immigrants from Romania are Tlingit-Haida (65.5%, a difference of 0.010%), Cypriot (65.5%, a difference of 0.010%), Indian (Asian) (65.5%, a difference of 0.020%), Latvian (65.5%, a difference of 0.020%), and Immigrants from Oceania (65.5%, a difference of 0.030%).
| Demographics | Rating | Rank | In Labor Force | Age > 16 |
| Guamanians/Chamorros | 92.4 /100 | #137 | Exceptional 65.6% |
| Immigrants | West Indies | 92.0 /100 | #138 | Exceptional 65.6% |
| Immigrants | Taiwan | 90.8 /100 | #139 | Exceptional 65.5% |
| Immigrants | Costa Rica | 90.8 /100 | #140 | Exceptional 65.5% |
| Samoans | 90.5 /100 | #141 | Exceptional 65.5% |
| Indians (Asian) | 89.5 /100 | #142 | Excellent 65.5% |
| Latvians | 89.4 /100 | #143 | Excellent 65.5% |
| Immigrants | Romania | 88.6 /100 | #144 | Excellent 65.5% |
| Tlingit-Haida | 88.3 /100 | #145 | Excellent 65.5% |
| Cypriots | 88.2 /100 | #146 | Excellent 65.5% |
| Immigrants | Oceania | 87.5 /100 | #147 | Excellent 65.5% |
| Bhutanese | 86.3 /100 | #148 | Excellent 65.5% |
| Immigrants | Albania | 85.7 /100 | #149 | Excellent 65.4% |
| Immigrants | Immigrants | 81.9 /100 | #150 | Excellent 65.4% |
| Czechs | 81.5 /100 | #151 | Excellent 65.4% |
Demographics Similar to Native Hawaiians by In Labor Force | Age > 16
In terms of in labor force | age > 16, the demographic groups most similar to Native Hawaiians are Hmong (64.1%, a difference of 0.0%), Immigrants from Cuba (64.1%, a difference of 0.020%), Mexican (64.1%, a difference of 0.020%), French American Indian (64.1%, a difference of 0.020%), and Guyanese (64.1%, a difference of 0.030%).
| Demographics | Rating | Rank | In Labor Force | Age > 16 |
| Cubans | 0.5 /100 | #265 | Tragic 64.2% |
| Immigrants | England | 0.5 /100 | #266 | Tragic 64.2% |
| Canadians | 0.5 /100 | #267 | Tragic 64.1% |
| Spaniards | 0.5 /100 | #268 | Tragic 64.1% |
| Irish | 0.4 /100 | #269 | Tragic 64.1% |
| Guyanese | 0.4 /100 | #270 | Tragic 64.1% |
| Dominicans | 0.4 /100 | #271 | Tragic 64.1% |
| Native Hawaiians | 0.3 /100 | #272 | Tragic 64.1% |
| Hmong | 0.3 /100 | #273 | Tragic 64.1% |
| Immigrants | Cuba | 0.3 /100 | #274 | Tragic 64.1% |
| Mexicans | 0.3 /100 | #275 | Tragic 64.1% |
| French American Indians | 0.3 /100 | #276 | Tragic 64.1% |
| Immigrants | Bahamas | 0.3 /100 | #277 | Tragic 64.0% |
| Assyrians/Chaldeans/Syriacs | 0.3 /100 | #278 | Tragic 64.0% |
| Welsh | 0.2 /100 | #279 | Tragic 64.0% |