Puget Sound Salish vs Ottawa In Labor Force | Age > 16
COMPARE
Puget Sound Salish
Ottawa
In Labor Force | Age > 16
In Labor Force | Age > 16 Comparison
Puget Sound Salish
Ottawa
63.7%
IN LABOR FORCE | AGE > 16
0.0/ 100
METRIC RATING
294th/ 347
METRIC RANK
62.0%
IN LABOR FORCE | AGE > 16
0.0/ 100
METRIC RATING
322nd/ 347
METRIC RANK
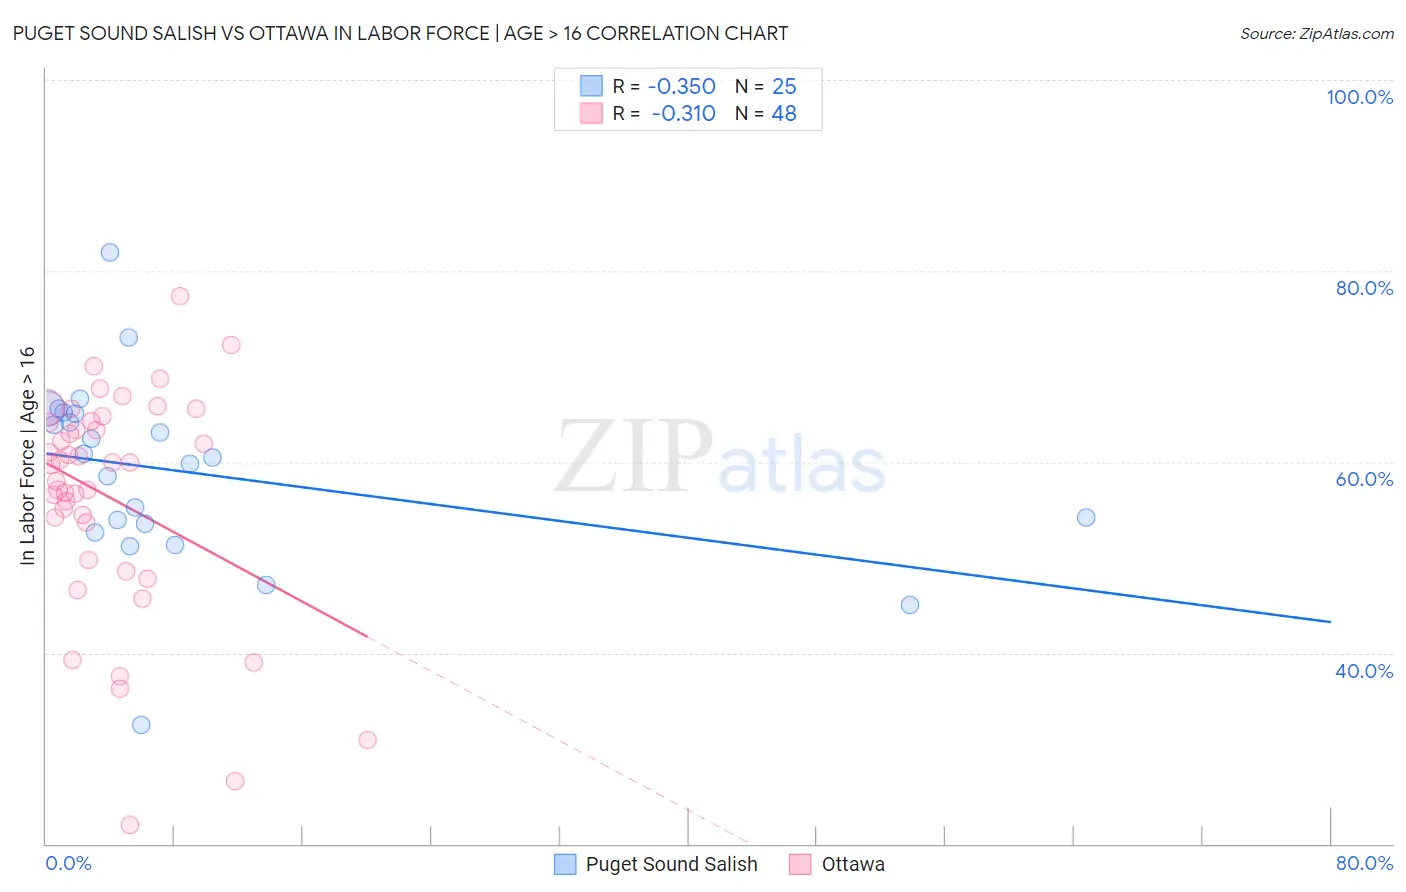
Puget Sound Salish vs Ottawa In Labor Force | Age > 16 Correlation Chart
The statistical analysis conducted on geographies consisting of 46,155,746 people shows a mild negative correlation between the proportion of Puget Sound Salish and labor force participation rate among population ages 16 and over in the United States with a correlation coefficient (R) of -0.350 and weighted average of 63.7%. Similarly, the statistical analysis conducted on geographies consisting of 49,955,399 people shows a mild negative correlation between the proportion of Ottawa and labor force participation rate among population ages 16 and over in the United States with a correlation coefficient (R) of -0.310 and weighted average of 62.0%, a difference of 2.8%.
In Labor Force | Age > 16 Correlation Summary
| Measurement | Puget Sound Salish | Ottawa |
| Minimum | 32.5% | 21.9% |
| Maximum | 81.9% | 77.4% |
| Range | 49.4% | 55.5% |
| Mean | 58.9% | 56.2% |
| Median | 60.4% | 59.9% |
| Interquartile 25% (IQ1) | 53.1% | 51.7% |
| Interquartile 75% (IQ3) | 65.1% | 64.2% |
| Interquartile Range (IQR) | 12.0% | 12.5% |
| Standard Deviation (Sample) | 9.8% | 11.9% |
| Standard Deviation (Population) | 9.6% | 11.7% |
Similar Demographics by In Labor Force | Age > 16
Demographics Similar to Puget Sound Salish by In Labor Force | Age > 16
In terms of in labor force | age > 16, the demographic groups most similar to Puget Sound Salish are English (63.7%, a difference of 0.030%), Immigrants from Canada (63.7%, a difference of 0.050%), Spanish American Indian (63.8%, a difference of 0.070%), Immigrants from North America (63.7%, a difference of 0.070%), and Nepalese (63.8%, a difference of 0.13%).
| Demographics | Rating | Rank | In Labor Force | Age > 16 |
| Scottish | 0.1 /100 | #287 | Tragic 63.9% |
| Spanish | 0.1 /100 | #288 | Tragic 63.9% |
| Celtics | 0.1 /100 | #289 | Tragic 63.8% |
| Hungarians | 0.1 /100 | #290 | Tragic 63.8% |
| Nepalese | 0.1 /100 | #291 | Tragic 63.8% |
| Spanish American Indians | 0.1 /100 | #292 | Tragic 63.8% |
| English | 0.1 /100 | #293 | Tragic 63.7% |
| Puget Sound Salish | 0.0 /100 | #294 | Tragic 63.7% |
| Immigrants | Canada | 0.0 /100 | #295 | Tragic 63.7% |
| Immigrants | North America | 0.0 /100 | #296 | Tragic 63.7% |
| Immigrants | Grenada | 0.0 /100 | #297 | Tragic 63.6% |
| Comanche | 0.0 /100 | #298 | Tragic 63.6% |
| Whites/Caucasians | 0.0 /100 | #299 | Tragic 63.6% |
| Immigrants | Azores | 0.0 /100 | #300 | Tragic 63.6% |
| Spanish Americans | 0.0 /100 | #301 | Tragic 63.6% |
Demographics Similar to Ottawa by In Labor Force | Age > 16
In terms of in labor force | age > 16, the demographic groups most similar to Ottawa are Seminole (62.0%, a difference of 0.030%), Cheyenne (62.0%, a difference of 0.070%), Cherokee (61.9%, a difference of 0.11%), American (62.1%, a difference of 0.16%), and Yakama (62.1%, a difference of 0.19%).
| Demographics | Rating | Rank | In Labor Force | Age > 16 |
| Potawatomi | 0.0 /100 | #315 | Tragic 62.8% |
| Yup'ik | 0.0 /100 | #316 | Tragic 62.7% |
| Kiowa | 0.0 /100 | #317 | Tragic 62.4% |
| Chickasaw | 0.0 /100 | #318 | Tragic 62.3% |
| Arapaho | 0.0 /100 | #319 | Tragic 62.1% |
| Yakama | 0.0 /100 | #320 | Tragic 62.1% |
| Americans | 0.0 /100 | #321 | Tragic 62.1% |
| Ottawa | 0.0 /100 | #322 | Tragic 62.0% |
| Seminole | 0.0 /100 | #323 | Tragic 62.0% |
| Cheyenne | 0.0 /100 | #324 | Tragic 62.0% |
| Cherokee | 0.0 /100 | #325 | Tragic 61.9% |
| Sioux | 0.0 /100 | #326 | Tragic 61.8% |
| Cajuns | 0.0 /100 | #327 | Tragic 61.8% |
| Dutch West Indians | 0.0 /100 | #328 | Tragic 61.7% |
| Choctaw | 0.0 /100 | #329 | Tragic 61.5% |