Immigrants from Romania vs Immigrants from South Eastern Asia In Labor Force | Age > 16
COMPARE
Immigrants from Romania
Immigrants from South Eastern Asia
In Labor Force | Age > 16
In Labor Force | Age > 16 Comparison
Immigrants from Romania
Immigrants from South Eastern Asia
65.5%
IN LABOR FORCE | AGE > 16
88.6/ 100
METRIC RATING
144th/ 347
METRIC RANK
65.9%
IN LABOR FORCE | AGE > 16
98.5/ 100
METRIC RATING
103rd/ 347
METRIC RANK
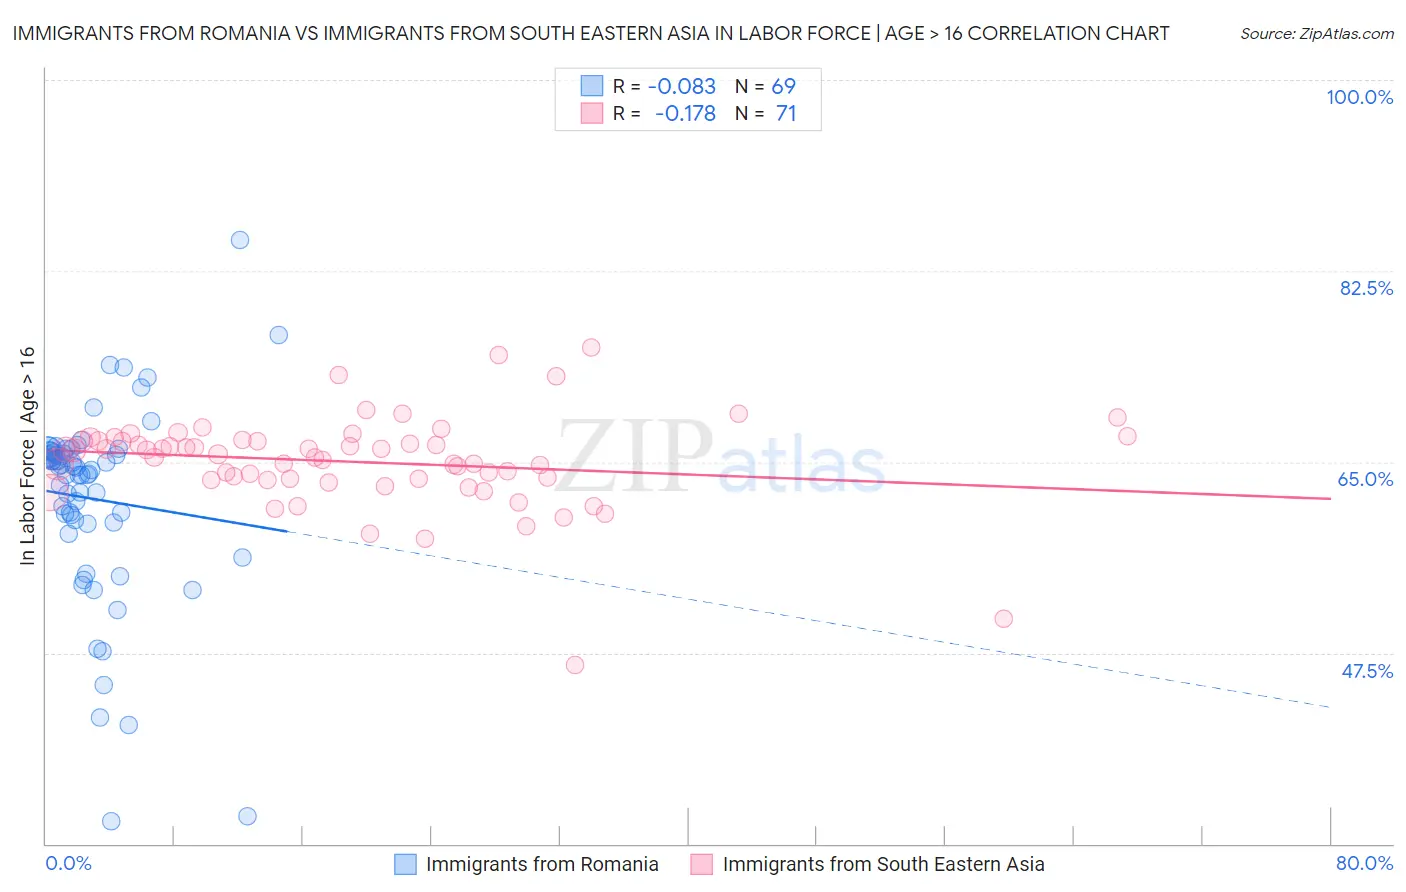
Immigrants from Romania vs Immigrants from South Eastern Asia In Labor Force | Age > 16 Correlation Chart
The statistical analysis conducted on geographies consisting of 257,014,238 people shows a slight negative correlation between the proportion of Immigrants from Romania and labor force participation rate among population ages 16 and over in the United States with a correlation coefficient (R) of -0.083 and weighted average of 65.5%. Similarly, the statistical analysis conducted on geographies consisting of 512,696,478 people shows a poor negative correlation between the proportion of Immigrants from South Eastern Asia and labor force participation rate among population ages 16 and over in the United States with a correlation coefficient (R) of -0.178 and weighted average of 65.9%, a difference of 0.60%.
In Labor Force | Age > 16 Correlation Summary
| Measurement | Immigrants from Romania | Immigrants from South Eastern Asia |
| Minimum | 32.1% | 46.4% |
| Maximum | 85.3% | 75.5% |
| Range | 53.2% | 29.1% |
| Mean | 61.6% | 65.0% |
| Median | 64.3% | 65.7% |
| Interquartile 25% (IQ1) | 59.4% | 63.3% |
| Interquartile 75% (IQ3) | 66.0% | 66.9% |
| Interquartile Range (IQR) | 6.6% | 3.6% |
| Standard Deviation (Sample) | 9.1% | 4.4% |
| Standard Deviation (Population) | 9.0% | 4.4% |
Similar Demographics by In Labor Force | Age > 16
Demographics Similar to Immigrants from Romania by In Labor Force | Age > 16
In terms of in labor force | age > 16, the demographic groups most similar to Immigrants from Romania are Tlingit-Haida (65.5%, a difference of 0.010%), Cypriot (65.5%, a difference of 0.010%), Indian (Asian) (65.5%, a difference of 0.020%), Latvian (65.5%, a difference of 0.020%), and Immigrants from Oceania (65.5%, a difference of 0.030%).
| Demographics | Rating | Rank | In Labor Force | Age > 16 |
| Guamanians/Chamorros | 92.4 /100 | #137 | Exceptional 65.6% |
| Immigrants | West Indies | 92.0 /100 | #138 | Exceptional 65.6% |
| Immigrants | Taiwan | 90.8 /100 | #139 | Exceptional 65.5% |
| Immigrants | Costa Rica | 90.8 /100 | #140 | Exceptional 65.5% |
| Samoans | 90.5 /100 | #141 | Exceptional 65.5% |
| Indians (Asian) | 89.5 /100 | #142 | Excellent 65.5% |
| Latvians | 89.4 /100 | #143 | Excellent 65.5% |
| Immigrants | Romania | 88.6 /100 | #144 | Excellent 65.5% |
| Tlingit-Haida | 88.3 /100 | #145 | Excellent 65.5% |
| Cypriots | 88.2 /100 | #146 | Excellent 65.5% |
| Immigrants | Oceania | 87.5 /100 | #147 | Excellent 65.5% |
| Bhutanese | 86.3 /100 | #148 | Excellent 65.5% |
| Immigrants | Albania | 85.7 /100 | #149 | Excellent 65.4% |
| Immigrants | Immigrants | 81.9 /100 | #150 | Excellent 65.4% |
| Czechs | 81.5 /100 | #151 | Excellent 65.4% |
Demographics Similar to Immigrants from South Eastern Asia by In Labor Force | Age > 16
In terms of in labor force | age > 16, the demographic groups most similar to Immigrants from South Eastern Asia are Palestinian (65.9%, a difference of 0.010%), Immigrants from Colombia (65.9%, a difference of 0.020%), Uruguayan (65.9%, a difference of 0.020%), Colombian (65.9%, a difference of 0.020%), and Immigrants from Australia (65.9%, a difference of 0.030%).
| Demographics | Rating | Rank | In Labor Force | Age > 16 |
| Bangladeshis | 98.9 /100 | #96 | Exceptional 65.9% |
| Filipinos | 98.9 /100 | #97 | Exceptional 65.9% |
| Immigrants | Chile | 98.7 /100 | #98 | Exceptional 65.9% |
| Immigrants | Australia | 98.7 /100 | #99 | Exceptional 65.9% |
| Okinawans | 98.7 /100 | #100 | Exceptional 65.9% |
| Immigrants | Colombia | 98.6 /100 | #101 | Exceptional 65.9% |
| Uruguayans | 98.6 /100 | #102 | Exceptional 65.9% |
| Immigrants | South Eastern Asia | 98.5 /100 | #103 | Exceptional 65.9% |
| Palestinians | 98.5 /100 | #104 | Exceptional 65.9% |
| Colombians | 98.4 /100 | #105 | Exceptional 65.9% |
| Immigrants | Serbia | 98.1 /100 | #106 | Exceptional 65.8% |
| Immigrants | Poland | 98.1 /100 | #107 | Exceptional 65.8% |
| Immigrants | Spain | 98.0 /100 | #108 | Exceptional 65.8% |
| Immigrants | Japan | 98.0 /100 | #109 | Exceptional 65.8% |
| Japanese | 97.7 /100 | #110 | Exceptional 65.8% |