Immigrants from Iran vs Immigrants from France In Labor Force | Age 20-24
COMPARE
Immigrants from Iran
Immigrants from France
In Labor Force | Age 20-24
In Labor Force | Age 20-24 Comparison
Immigrants from Iran
Immigrants from France
71.8%
IN LABOR FORCE | AGE 20-24
0.0/ 100
METRIC RATING
315th/ 347
METRIC RANK
74.1%
IN LABOR FORCE | AGE 20-24
3.3/ 100
METRIC RATING
236th/ 347
METRIC RANK
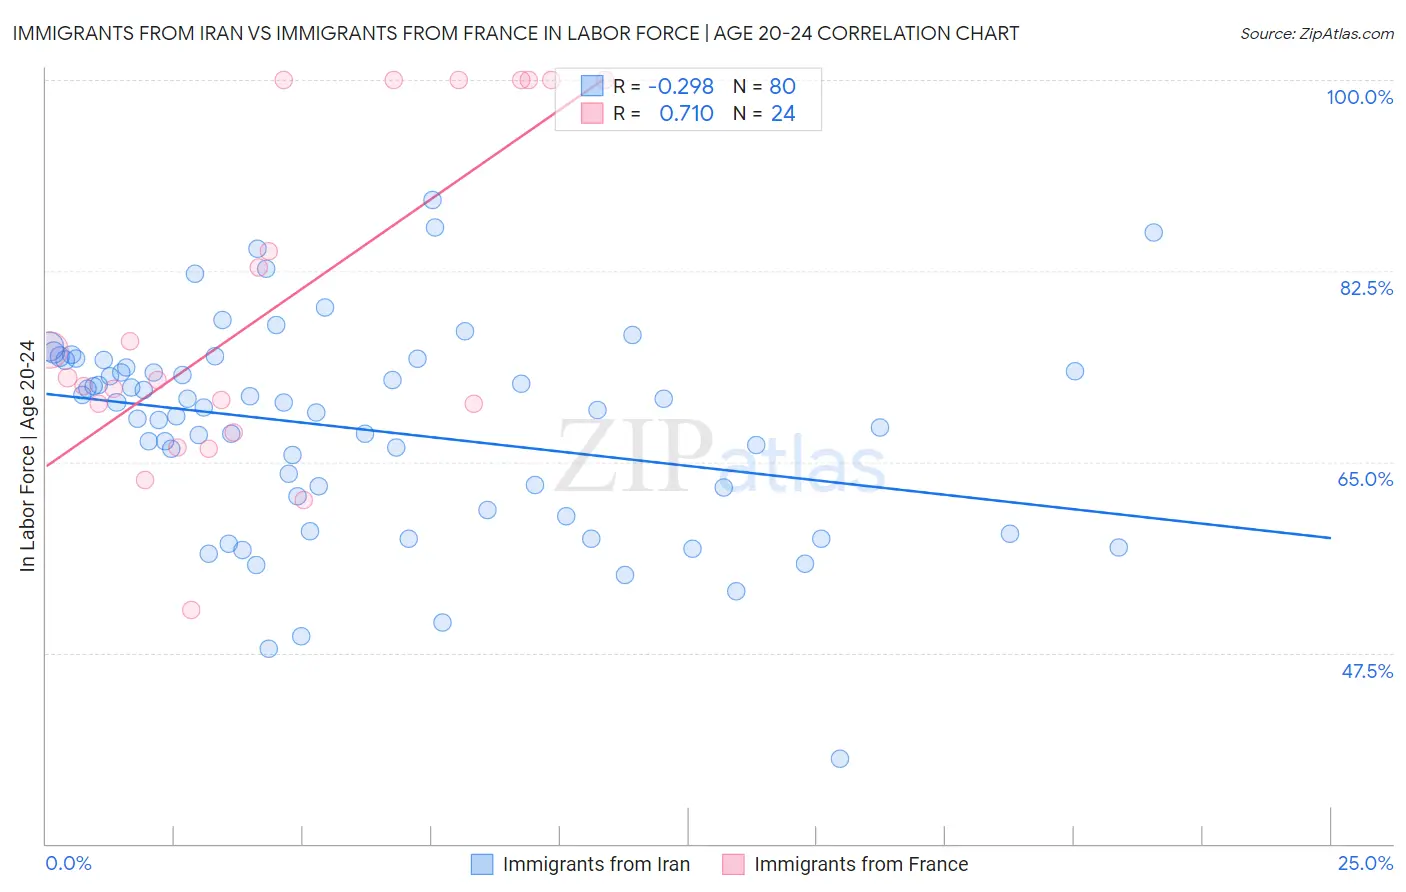
Immigrants from Iran vs Immigrants from France In Labor Force | Age 20-24 Correlation Chart
The statistical analysis conducted on geographies consisting of 279,798,180 people shows a weak negative correlation between the proportion of Immigrants from Iran and labor force participation rate among population between the ages 20 and 24 in the United States with a correlation coefficient (R) of -0.298 and weighted average of 71.8%. Similarly, the statistical analysis conducted on geographies consisting of 287,788,278 people shows a strong positive correlation between the proportion of Immigrants from France and labor force participation rate among population between the ages 20 and 24 in the United States with a correlation coefficient (R) of 0.710 and weighted average of 74.1%, a difference of 3.2%.
In Labor Force | Age 20-24 Correlation Summary
| Measurement | Immigrants from Iran | Immigrants from France |
| Minimum | 37.8% | 51.4% |
| Maximum | 89.0% | 100.0% |
| Range | 51.2% | 48.6% |
| Mean | 68.0% | 79.0% |
| Median | 69.8% | 72.6% |
| Interquartile 25% (IQ1) | 61.2% | 69.0% |
| Interquartile 75% (IQ3) | 74.0% | 100.0% |
| Interquartile Range (IQR) | 12.8% | 31.0% |
| Standard Deviation (Sample) | 9.5% | 15.2% |
| Standard Deviation (Population) | 9.4% | 14.9% |
Similar Demographics by In Labor Force | Age 20-24
Demographics Similar to Immigrants from Iran by In Labor Force | Age 20-24
In terms of in labor force | age 20-24, the demographic groups most similar to Immigrants from Iran are Immigrants from Eastern Asia (71.8%, a difference of 0.040%), Immigrants from Dominica (71.9%, a difference of 0.090%), Indian (Asian) (71.9%, a difference of 0.090%), Immigrants from Caribbean (71.9%, a difference of 0.14%), and Immigrants from Armenia (71.7%, a difference of 0.21%).
| Demographics | Rating | Rank | In Labor Force | Age 20-24 |
| Soviet Union | 0.0 /100 | #308 | Tragic 72.3% |
| Tsimshian | 0.0 /100 | #309 | Tragic 72.3% |
| Immigrants | Cuba | 0.0 /100 | #310 | Tragic 72.0% |
| Apache | 0.0 /100 | #311 | Tragic 72.0% |
| Immigrants | Caribbean | 0.0 /100 | #312 | Tragic 71.9% |
| Immigrants | Dominica | 0.0 /100 | #313 | Tragic 71.9% |
| Indians (Asian) | 0.0 /100 | #314 | Tragic 71.9% |
| Immigrants | Iran | 0.0 /100 | #315 | Tragic 71.8% |
| Immigrants | Eastern Asia | 0.0 /100 | #316 | Tragic 71.8% |
| Immigrants | Armenia | 0.0 /100 | #317 | Tragic 71.7% |
| Immigrants | Hong Kong | 0.0 /100 | #318 | Tragic 71.6% |
| Immigrants | Israel | 0.0 /100 | #319 | Tragic 71.6% |
| Trinidadians and Tobagonians | 0.0 /100 | #320 | Tragic 71.5% |
| Immigrants | Taiwan | 0.0 /100 | #321 | Tragic 71.5% |
| Filipinos | 0.0 /100 | #322 | Tragic 71.4% |
Demographics Similar to Immigrants from France by In Labor Force | Age 20-24
In terms of in labor force | age 20-24, the demographic groups most similar to Immigrants from France are Bermudan (74.1%, a difference of 0.010%), Laotian (74.1%, a difference of 0.020%), Immigrants (74.1%, a difference of 0.030%), Immigrants from Chile (74.1%, a difference of 0.040%), and Immigrants from Japan (74.1%, a difference of 0.040%).
| Demographics | Rating | Rank | In Labor Force | Age 20-24 |
| Immigrants | Sweden | 4.6 /100 | #229 | Tragic 74.2% |
| Immigrants | Albania | 4.3 /100 | #230 | Tragic 74.2% |
| Immigrants | Greece | 4.1 /100 | #231 | Tragic 74.2% |
| Immigrants | Switzerland | 4.1 /100 | #232 | Tragic 74.2% |
| Immigrants | Chile | 3.7 /100 | #233 | Tragic 74.1% |
| Immigrants | Immigrants | 3.6 /100 | #234 | Tragic 74.1% |
| Laotians | 3.5 /100 | #235 | Tragic 74.1% |
| Immigrants | France | 3.3 /100 | #236 | Tragic 74.1% |
| Bermudans | 3.2 /100 | #237 | Tragic 74.1% |
| Immigrants | Japan | 3.0 /100 | #238 | Tragic 74.1% |
| Immigrants | Latin America | 2.7 /100 | #239 | Tragic 74.1% |
| Immigrants | Sri Lanka | 2.3 /100 | #240 | Tragic 74.0% |
| Immigrants | Senegal | 2.1 /100 | #241 | Tragic 74.0% |
| Thais | 2.1 /100 | #242 | Tragic 74.0% |
| Immigrants | Syria | 1.9 /100 | #243 | Tragic 74.0% |