Immigrants from Iran vs Immigrants from France Disability Age Under 5
COMPARE
Immigrants from Iran
Immigrants from France
Disability Age Under 5
Disability Age Under 5 Comparison
Immigrants from Iran
Immigrants from France
1.00%
DISABILITY AGE UNDER 5
100.0/ 100
METRIC RATING
22nd/ 347
METRIC RANK
1.2%
DISABILITY AGE UNDER 5
88.4/ 100
METRIC RATING
128th/ 347
METRIC RANK
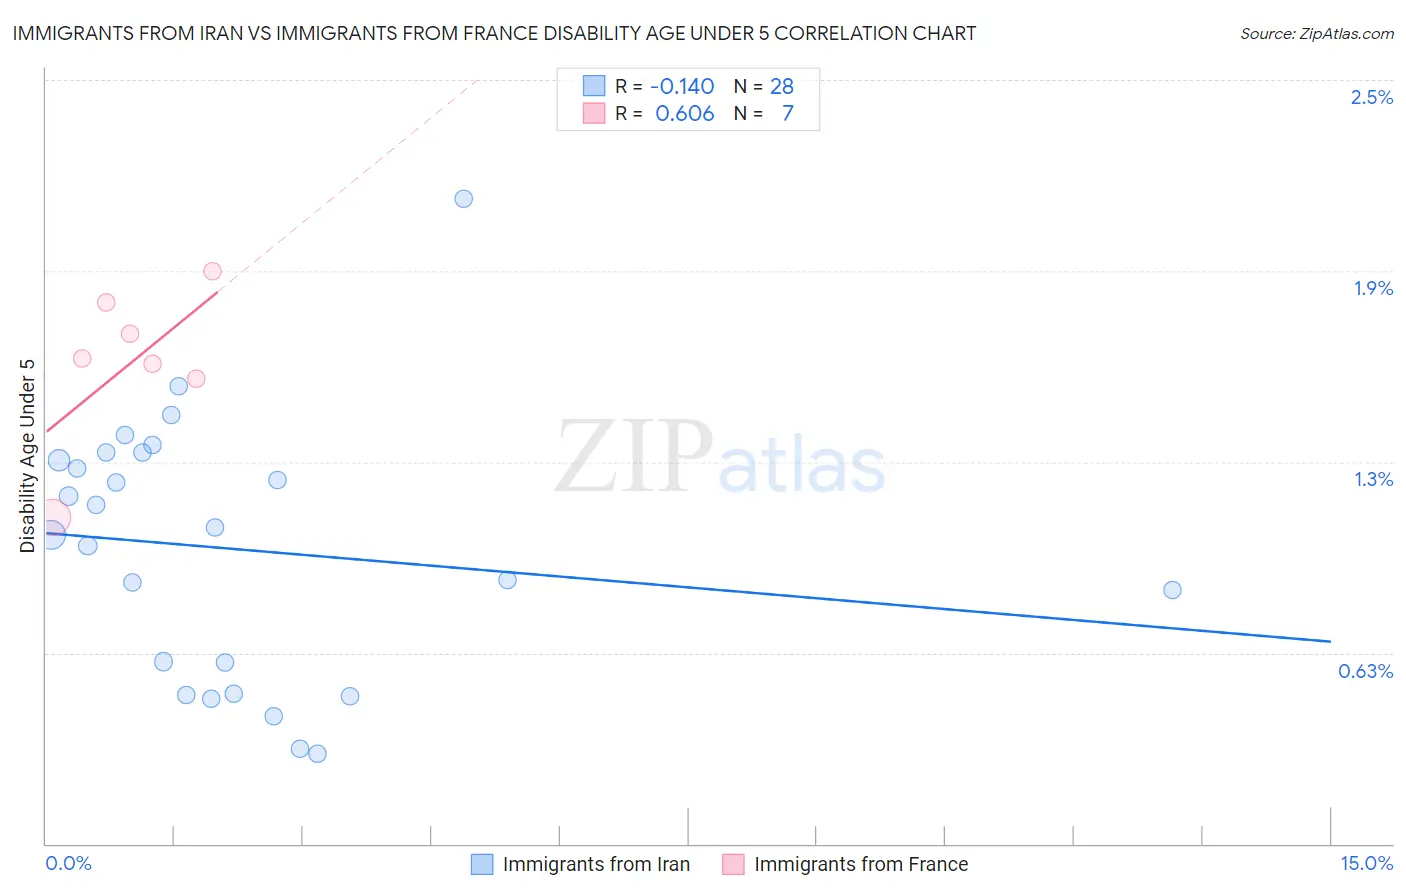
Immigrants from Iran vs Immigrants from France Disability Age Under 5 Correlation Chart
The statistical analysis conducted on geographies consisting of 168,672,244 people shows a poor negative correlation between the proportion of Immigrants from Iran and percentage of population with a disability under the age of 5 in the United States with a correlation coefficient (R) of -0.140 and weighted average of 1.00%. Similarly, the statistical analysis conducted on geographies consisting of 171,123,131 people shows a significant positive correlation between the proportion of Immigrants from France and percentage of population with a disability under the age of 5 in the United States with a correlation coefficient (R) of 0.606 and weighted average of 1.2%, a difference of 18.5%.
Disability Age Under 5 Correlation Summary
| Measurement | Immigrants from Iran | Immigrants from France |
| Minimum | 0.30% | 1.1% |
| Maximum | 2.1% | 1.9% |
| Range | 1.8% | 0.81% |
| Mean | 0.97% | 1.6% |
| Median | 1.0% | 1.6% |
| Interquartile 25% (IQ1) | 0.54% | 1.5% |
| Interquartile 75% (IQ3) | 1.3% | 1.8% |
| Interquartile Range (IQR) | 0.73% | 0.25% |
| Standard Deviation (Sample) | 0.43% | 0.26% |
| Standard Deviation (Population) | 0.42% | 0.24% |
Similar Demographics by Disability Age Under 5
Demographics Similar to Immigrants from Iran by Disability Age Under 5
In terms of disability age under 5, the demographic groups most similar to Immigrants from Iran are Yakama (1.00%, a difference of 0.080%), Indian (Asian) (1.0%, a difference of 0.36%), Immigrants from Micronesia (1.0%, a difference of 0.67%), British West Indian (0.99%, a difference of 0.79%), and Immigrants from Taiwan (1.0%, a difference of 0.79%).
| Demographics | Rating | Rank | Disability Age Under 5 |
| Immigrants | Hong Kong | 100.0 /100 | #15 | Exceptional 0.95% |
| Immigrants | Israel | 100.0 /100 | #16 | Exceptional 0.96% |
| Immigrants | China | 100.0 /100 | #17 | Exceptional 0.96% |
| Immigrants | Barbados | 100.0 /100 | #18 | Exceptional 0.97% |
| Puget Sound Salish | 100.0 /100 | #19 | Exceptional 0.97% |
| Nepalese | 100.0 /100 | #20 | Exceptional 0.97% |
| British West Indians | 100.0 /100 | #21 | Exceptional 0.99% |
| Immigrants | Iran | 100.0 /100 | #22 | Exceptional 1.00% |
| Yakama | 100.0 /100 | #23 | Exceptional 1.00% |
| Indians (Asian) | 100.0 /100 | #24 | Exceptional 1.0% |
| Immigrants | Micronesia | 100.0 /100 | #25 | Exceptional 1.0% |
| Immigrants | Taiwan | 100.0 /100 | #26 | Exceptional 1.0% |
| Guyanese | 100.0 /100 | #27 | Exceptional 1.0% |
| Immigrants | Eastern Asia | 100.0 /100 | #28 | Exceptional 1.0% |
| Immigrants | Belarus | 100.0 /100 | #29 | Exceptional 1.0% |
Demographics Similar to Immigrants from France by Disability Age Under 5
In terms of disability age under 5, the demographic groups most similar to Immigrants from France are Immigrants from Romania (1.2%, a difference of 0.0%), Immigrants (1.2%, a difference of 0.090%), Korean (1.2%, a difference of 0.17%), Immigrants from Serbia (1.2%, a difference of 0.19%), and Immigrants from Eastern Europe (1.2%, a difference of 0.25%).
| Demographics | Rating | Rank | Disability Age Under 5 |
| Immigrants | Senegal | 91.4 /100 | #121 | Exceptional 1.2% |
| Aleuts | 90.7 /100 | #122 | Exceptional 1.2% |
| Zimbabweans | 90.6 /100 | #123 | Exceptional 1.2% |
| Immigrants | Cambodia | 90.5 /100 | #124 | Exceptional 1.2% |
| Japanese | 90.3 /100 | #125 | Exceptional 1.2% |
| Central Americans | 89.7 /100 | #126 | Excellent 1.2% |
| Immigrants | Romania | 88.4 /100 | #127 | Excellent 1.2% |
| Immigrants | France | 88.4 /100 | #128 | Excellent 1.2% |
| Immigrants | Immigrants | 88.0 /100 | #129 | Excellent 1.2% |
| Koreans | 87.7 /100 | #130 | Excellent 1.2% |
| Immigrants | Serbia | 87.6 /100 | #131 | Excellent 1.2% |
| Immigrants | Eastern Europe | 87.3 /100 | #132 | Excellent 1.2% |
| Immigrants | Spain | 86.5 /100 | #133 | Excellent 1.2% |
| Argentineans | 85.7 /100 | #134 | Excellent 1.2% |
| Fijians | 84.7 /100 | #135 | Excellent 1.2% |