Menominee vs Immigrants from France In Labor Force | Age 20-24
COMPARE
Menominee
Immigrants from France
In Labor Force | Age 20-24
In Labor Force | Age 20-24 Comparison
Menominee
Immigrants from France
68.7%
IN LABOR FORCE | AGE 20-24
0.0/ 100
METRIC RATING
340th/ 347
METRIC RANK
74.1%
IN LABOR FORCE | AGE 20-24
3.3/ 100
METRIC RATING
236th/ 347
METRIC RANK
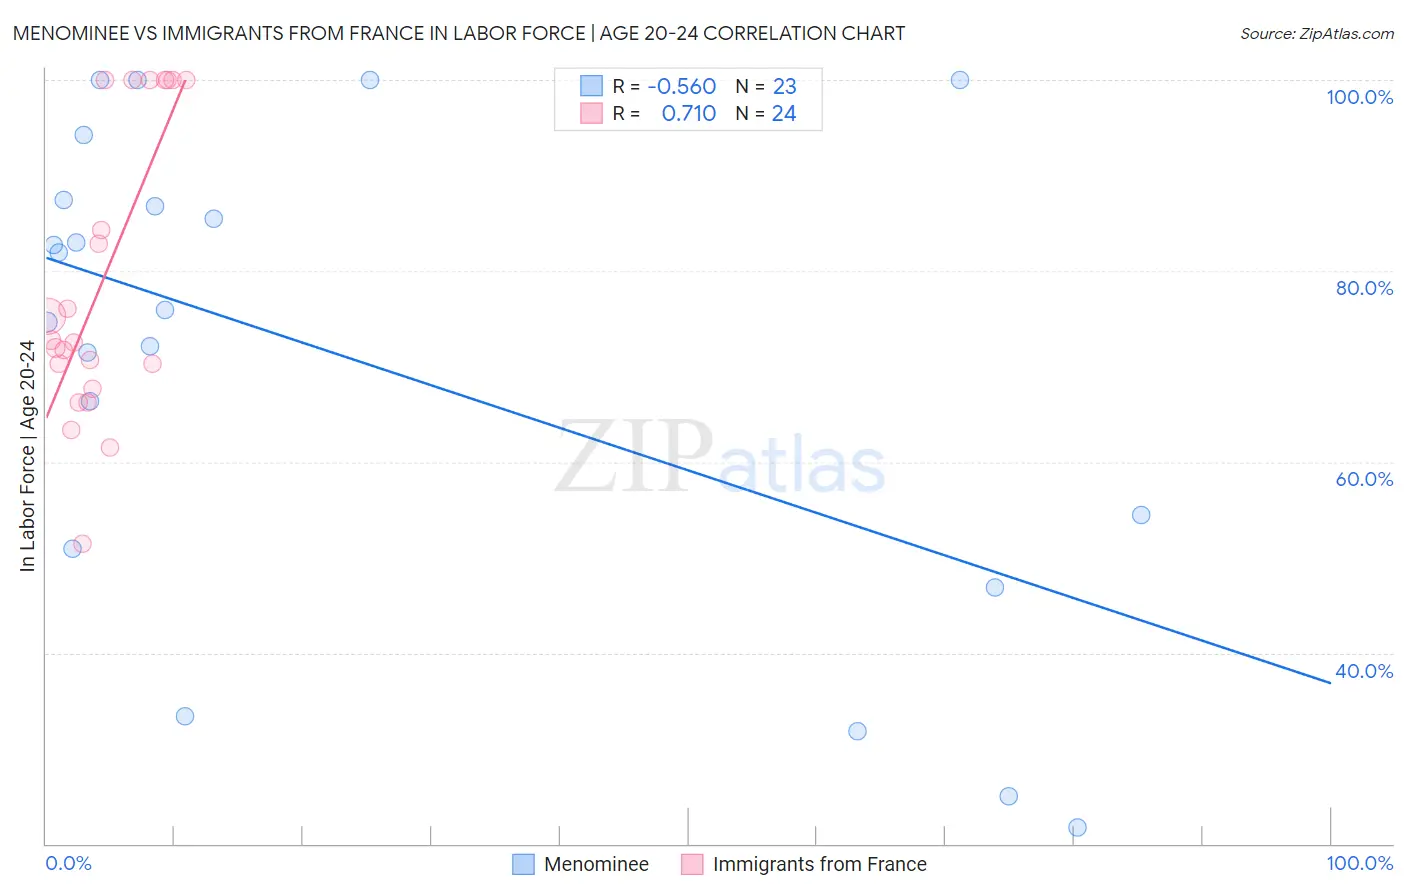
Menominee vs Immigrants from France In Labor Force | Age 20-24 Correlation Chart
The statistical analysis conducted on geographies consisting of 45,776,485 people shows a substantial negative correlation between the proportion of Menominee and labor force participation rate among population between the ages 20 and 24 in the United States with a correlation coefficient (R) of -0.560 and weighted average of 68.7%. Similarly, the statistical analysis conducted on geographies consisting of 287,788,278 people shows a strong positive correlation between the proportion of Immigrants from France and labor force participation rate among population between the ages 20 and 24 in the United States with a correlation coefficient (R) of 0.710 and weighted average of 74.1%, a difference of 7.9%.
In Labor Force | Age 20-24 Correlation Summary
| Measurement | Menominee | Immigrants from France |
| Minimum | 21.7% | 51.4% |
| Maximum | 100.0% | 100.0% |
| Range | 78.3% | 48.6% |
| Mean | 70.7% | 79.0% |
| Median | 75.9% | 72.6% |
| Interquartile 25% (IQ1) | 50.9% | 69.0% |
| Interquartile 75% (IQ3) | 87.4% | 100.0% |
| Interquartile Range (IQR) | 36.5% | 31.0% |
| Standard Deviation (Sample) | 25.1% | 15.2% |
| Standard Deviation (Population) | 24.5% | 14.9% |
Similar Demographics by In Labor Force | Age 20-24
Demographics Similar to Menominee by In Labor Force | Age 20-24
In terms of in labor force | age 20-24, the demographic groups most similar to Menominee are Tohono O'odham (68.6%, a difference of 0.13%), Immigrants from Yemen (68.9%, a difference of 0.31%), Pima (69.0%, a difference of 0.44%), Immigrants from St. Vincent and the Grenadines (68.4%, a difference of 0.44%), and Puerto Rican (68.3%, a difference of 0.56%).
| Demographics | Rating | Rank | In Labor Force | Age 20-24 |
| Yuman | 0.0 /100 | #333 | Tragic 70.3% |
| British West Indians | 0.0 /100 | #334 | Tragic 70.0% |
| Immigrants | Barbados | 0.0 /100 | #335 | Tragic 69.7% |
| Immigrants | Guyana | 0.0 /100 | #336 | Tragic 69.3% |
| Guyanese | 0.0 /100 | #337 | Tragic 69.2% |
| Pima | 0.0 /100 | #338 | Tragic 69.0% |
| Immigrants | Yemen | 0.0 /100 | #339 | Tragic 68.9% |
| Menominee | 0.0 /100 | #340 | Tragic 68.7% |
| Tohono O'odham | 0.0 /100 | #341 | Tragic 68.6% |
| Immigrants | St. Vincent and the Grenadines | 0.0 /100 | #342 | Tragic 68.4% |
| Puerto Ricans | 0.0 /100 | #343 | Tragic 68.3% |
| Immigrants | Grenada | 0.0 /100 | #344 | Tragic 67.2% |
| Hopi | 0.0 /100 | #345 | Tragic 66.0% |
| Lumbee | 0.0 /100 | #346 | Tragic 65.5% |
| Navajo | 0.0 /100 | #347 | Tragic 64.8% |
Demographics Similar to Immigrants from France by In Labor Force | Age 20-24
In terms of in labor force | age 20-24, the demographic groups most similar to Immigrants from France are Bermudan (74.1%, a difference of 0.010%), Laotian (74.1%, a difference of 0.020%), Immigrants (74.1%, a difference of 0.030%), Immigrants from Chile (74.1%, a difference of 0.040%), and Immigrants from Japan (74.1%, a difference of 0.040%).
| Demographics | Rating | Rank | In Labor Force | Age 20-24 |
| Immigrants | Sweden | 4.6 /100 | #229 | Tragic 74.2% |
| Immigrants | Albania | 4.3 /100 | #230 | Tragic 74.2% |
| Immigrants | Greece | 4.1 /100 | #231 | Tragic 74.2% |
| Immigrants | Switzerland | 4.1 /100 | #232 | Tragic 74.2% |
| Immigrants | Chile | 3.7 /100 | #233 | Tragic 74.1% |
| Immigrants | Immigrants | 3.6 /100 | #234 | Tragic 74.1% |
| Laotians | 3.5 /100 | #235 | Tragic 74.1% |
| Immigrants | France | 3.3 /100 | #236 | Tragic 74.1% |
| Bermudans | 3.2 /100 | #237 | Tragic 74.1% |
| Immigrants | Japan | 3.0 /100 | #238 | Tragic 74.1% |
| Immigrants | Latin America | 2.7 /100 | #239 | Tragic 74.1% |
| Immigrants | Sri Lanka | 2.3 /100 | #240 | Tragic 74.0% |
| Immigrants | Senegal | 2.1 /100 | #241 | Tragic 74.0% |
| Thais | 2.1 /100 | #242 | Tragic 74.0% |
| Immigrants | Syria | 1.9 /100 | #243 | Tragic 74.0% |