Immigrants from Iran vs Chilean In Labor Force | Age 20-24
COMPARE
Immigrants from Iran
Chilean
In Labor Force | Age 20-24
In Labor Force | Age 20-24 Comparison
Immigrants from Iran
Chileans
71.8%
IN LABOR FORCE | AGE 20-24
0.0/ 100
METRIC RATING
315th/ 347
METRIC RANK
74.5%
IN LABOR FORCE | AGE 20-24
12.5/ 100
METRIC RATING
217th/ 347
METRIC RANK
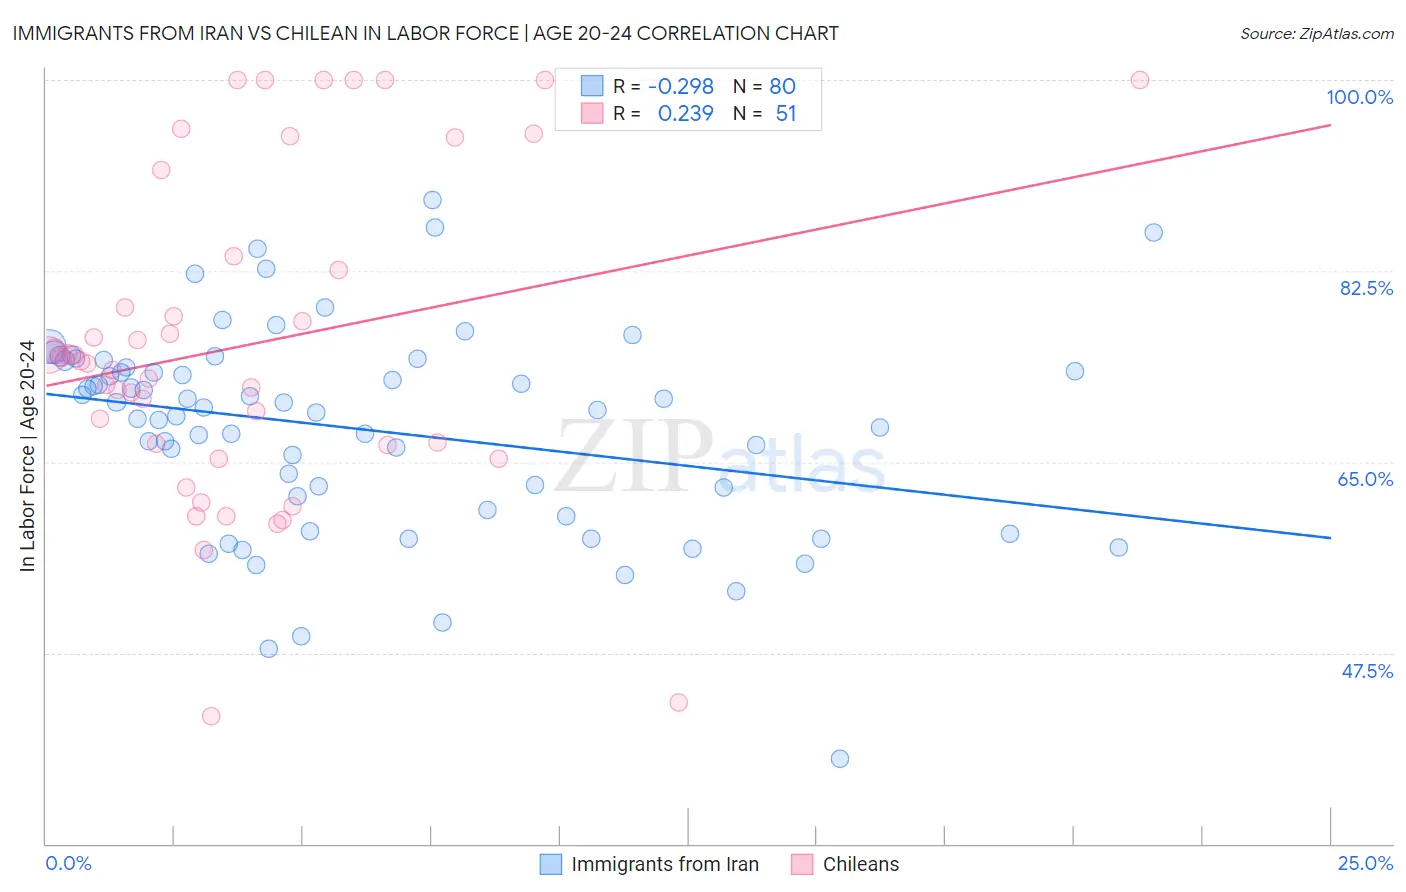
Immigrants from Iran vs Chilean In Labor Force | Age 20-24 Correlation Chart
The statistical analysis conducted on geographies consisting of 279,798,180 people shows a weak negative correlation between the proportion of Immigrants from Iran and labor force participation rate among population between the ages 20 and 24 in the United States with a correlation coefficient (R) of -0.298 and weighted average of 71.8%. Similarly, the statistical analysis conducted on geographies consisting of 256,670,531 people shows a weak positive correlation between the proportion of Chileans and labor force participation rate among population between the ages 20 and 24 in the United States with a correlation coefficient (R) of 0.239 and weighted average of 74.5%, a difference of 3.7%.
In Labor Force | Age 20-24 Correlation Summary
| Measurement | Immigrants from Iran | Chilean |
| Minimum | 37.8% | 41.7% |
| Maximum | 89.0% | 100.0% |
| Range | 51.2% | 58.3% |
| Mean | 68.0% | 75.8% |
| Median | 69.8% | 74.3% |
| Interquartile 25% (IQ1) | 61.2% | 66.6% |
| Interquartile 75% (IQ3) | 74.0% | 83.8% |
| Interquartile Range (IQR) | 12.8% | 17.3% |
| Standard Deviation (Sample) | 9.5% | 14.8% |
| Standard Deviation (Population) | 9.4% | 14.6% |
Similar Demographics by In Labor Force | Age 20-24
Demographics Similar to Immigrants from Iran by In Labor Force | Age 20-24
In terms of in labor force | age 20-24, the demographic groups most similar to Immigrants from Iran are Immigrants from Eastern Asia (71.8%, a difference of 0.040%), Immigrants from Dominica (71.9%, a difference of 0.090%), Indian (Asian) (71.9%, a difference of 0.090%), Immigrants from Caribbean (71.9%, a difference of 0.14%), and Immigrants from Armenia (71.7%, a difference of 0.21%).
| Demographics | Rating | Rank | In Labor Force | Age 20-24 |
| Soviet Union | 0.0 /100 | #308 | Tragic 72.3% |
| Tsimshian | 0.0 /100 | #309 | Tragic 72.3% |
| Immigrants | Cuba | 0.0 /100 | #310 | Tragic 72.0% |
| Apache | 0.0 /100 | #311 | Tragic 72.0% |
| Immigrants | Caribbean | 0.0 /100 | #312 | Tragic 71.9% |
| Immigrants | Dominica | 0.0 /100 | #313 | Tragic 71.9% |
| Indians (Asian) | 0.0 /100 | #314 | Tragic 71.9% |
| Immigrants | Iran | 0.0 /100 | #315 | Tragic 71.8% |
| Immigrants | Eastern Asia | 0.0 /100 | #316 | Tragic 71.8% |
| Immigrants | Armenia | 0.0 /100 | #317 | Tragic 71.7% |
| Immigrants | Hong Kong | 0.0 /100 | #318 | Tragic 71.6% |
| Immigrants | Israel | 0.0 /100 | #319 | Tragic 71.6% |
| Trinidadians and Tobagonians | 0.0 /100 | #320 | Tragic 71.5% |
| Immigrants | Taiwan | 0.0 /100 | #321 | Tragic 71.5% |
| Filipinos | 0.0 /100 | #322 | Tragic 71.4% |
Demographics Similar to Chileans by In Labor Force | Age 20-24
In terms of in labor force | age 20-24, the demographic groups most similar to Chileans are Immigrants from Ghana (74.5%, a difference of 0.010%), Immigrants from Kuwait (74.5%, a difference of 0.010%), Immigrants from Southern Europe (74.5%, a difference of 0.020%), Creek (74.5%, a difference of 0.030%), and Peruvian (74.5%, a difference of 0.030%).
| Demographics | Rating | Rank | In Labor Force | Age 20-24 |
| Uruguayans | 15.1 /100 | #210 | Poor 74.6% |
| Immigrants | Australia | 14.7 /100 | #211 | Poor 74.6% |
| Creek | 13.3 /100 | #212 | Poor 74.5% |
| Peruvians | 13.3 /100 | #213 | Poor 74.5% |
| Immigrants | Southern Europe | 13.2 /100 | #214 | Poor 74.5% |
| Immigrants | Ghana | 12.7 /100 | #215 | Poor 74.5% |
| Immigrants | Kuwait | 12.7 /100 | #216 | Poor 74.5% |
| Chileans | 12.5 /100 | #217 | Poor 74.5% |
| Immigrants | Peru | 10.6 /100 | #218 | Poor 74.5% |
| Nepalese | 10.5 /100 | #219 | Poor 74.5% |
| Immigrants | Norway | 10.3 /100 | #220 | Poor 74.5% |
| Chickasaw | 10.3 /100 | #221 | Poor 74.5% |
| Immigrants | India | 9.9 /100 | #222 | Tragic 74.4% |
| Hispanics or Latinos | 7.9 /100 | #223 | Tragic 74.4% |
| Seminole | 6.9 /100 | #224 | Tragic 74.3% |