Immigrants from Iran vs Immigrants from Bahamas In Labor Force | Age 20-24
COMPARE
Immigrants from Iran
Immigrants from Bahamas
In Labor Force | Age 20-24
In Labor Force | Age 20-24 Comparison
Immigrants from Iran
Immigrants from Bahamas
71.8%
IN LABOR FORCE | AGE 20-24
0.0/ 100
METRIC RATING
315th/ 347
METRIC RANK
73.2%
IN LABOR FORCE | AGE 20-24
0.1/ 100
METRIC RATING
283rd/ 347
METRIC RANK
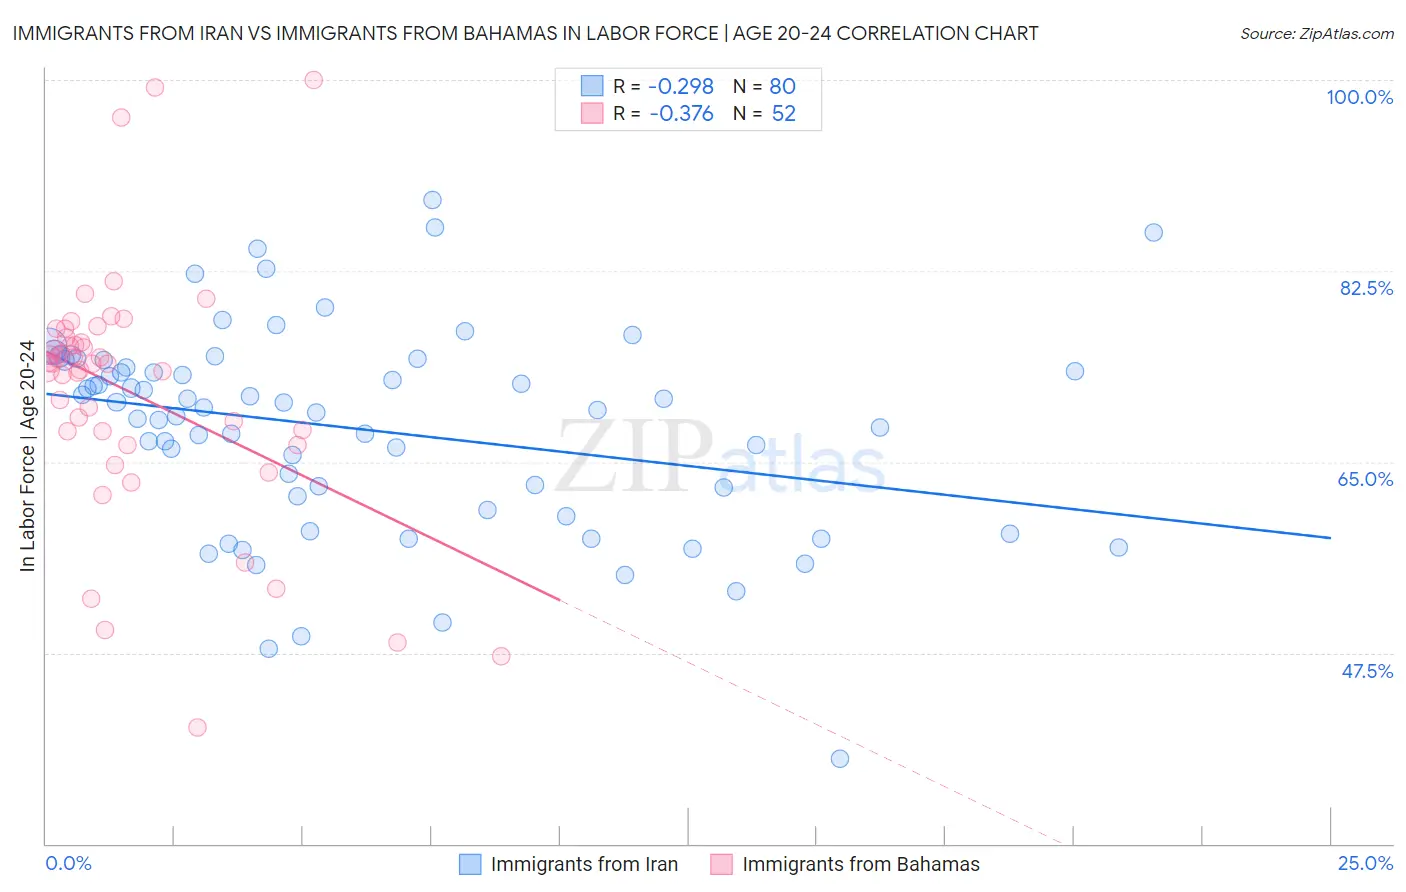
Immigrants from Iran vs Immigrants from Bahamas In Labor Force | Age 20-24 Correlation Chart
The statistical analysis conducted on geographies consisting of 279,798,180 people shows a weak negative correlation between the proportion of Immigrants from Iran and labor force participation rate among population between the ages 20 and 24 in the United States with a correlation coefficient (R) of -0.298 and weighted average of 71.8%. Similarly, the statistical analysis conducted on geographies consisting of 104,660,566 people shows a mild negative correlation between the proportion of Immigrants from Bahamas and labor force participation rate among population between the ages 20 and 24 in the United States with a correlation coefficient (R) of -0.376 and weighted average of 73.2%, a difference of 2.0%.
In Labor Force | Age 20-24 Correlation Summary
| Measurement | Immigrants from Iran | Immigrants from Bahamas |
| Minimum | 37.8% | 40.7% |
| Maximum | 89.0% | 100.0% |
| Range | 51.2% | 59.3% |
| Mean | 68.0% | 71.4% |
| Median | 69.8% | 74.0% |
| Interquartile 25% (IQ1) | 61.2% | 67.2% |
| Interquartile 75% (IQ3) | 74.0% | 76.2% |
| Interquartile Range (IQR) | 12.8% | 9.0% |
| Standard Deviation (Sample) | 9.5% | 11.5% |
| Standard Deviation (Population) | 9.4% | 11.4% |
Similar Demographics by In Labor Force | Age 20-24
Demographics Similar to Immigrants from Iran by In Labor Force | Age 20-24
In terms of in labor force | age 20-24, the demographic groups most similar to Immigrants from Iran are Immigrants from Eastern Asia (71.8%, a difference of 0.040%), Immigrants from Dominica (71.9%, a difference of 0.090%), Indian (Asian) (71.9%, a difference of 0.090%), Immigrants from Caribbean (71.9%, a difference of 0.14%), and Immigrants from Armenia (71.7%, a difference of 0.21%).
| Demographics | Rating | Rank | In Labor Force | Age 20-24 |
| Soviet Union | 0.0 /100 | #308 | Tragic 72.3% |
| Tsimshian | 0.0 /100 | #309 | Tragic 72.3% |
| Immigrants | Cuba | 0.0 /100 | #310 | Tragic 72.0% |
| Apache | 0.0 /100 | #311 | Tragic 72.0% |
| Immigrants | Caribbean | 0.0 /100 | #312 | Tragic 71.9% |
| Immigrants | Dominica | 0.0 /100 | #313 | Tragic 71.9% |
| Indians (Asian) | 0.0 /100 | #314 | Tragic 71.9% |
| Immigrants | Iran | 0.0 /100 | #315 | Tragic 71.8% |
| Immigrants | Eastern Asia | 0.0 /100 | #316 | Tragic 71.8% |
| Immigrants | Armenia | 0.0 /100 | #317 | Tragic 71.7% |
| Immigrants | Hong Kong | 0.0 /100 | #318 | Tragic 71.6% |
| Immigrants | Israel | 0.0 /100 | #319 | Tragic 71.6% |
| Trinidadians and Tobagonians | 0.0 /100 | #320 | Tragic 71.5% |
| Immigrants | Taiwan | 0.0 /100 | #321 | Tragic 71.5% |
| Filipinos | 0.0 /100 | #322 | Tragic 71.4% |
Demographics Similar to Immigrants from Bahamas by In Labor Force | Age 20-24
In terms of in labor force | age 20-24, the demographic groups most similar to Immigrants from Bahamas are Immigrants from Venezuela (73.2%, a difference of 0.010%), Immigrants from Spain (73.2%, a difference of 0.010%), Kiowa (73.2%, a difference of 0.020%), Bahamian (73.3%, a difference of 0.050%), and Nicaraguan (73.2%, a difference of 0.080%).
| Demographics | Rating | Rank | In Labor Force | Age 20-24 |
| Mongolians | 0.2 /100 | #276 | Tragic 73.3% |
| Immigrants | Malaysia | 0.2 /100 | #277 | Tragic 73.3% |
| Cypriots | 0.2 /100 | #278 | Tragic 73.3% |
| Venezuelans | 0.2 /100 | #279 | Tragic 73.3% |
| Bahamians | 0.1 /100 | #280 | Tragic 73.3% |
| Immigrants | Venezuela | 0.1 /100 | #281 | Tragic 73.2% |
| Immigrants | Spain | 0.1 /100 | #282 | Tragic 73.2% |
| Immigrants | Bahamas | 0.1 /100 | #283 | Tragic 73.2% |
| Kiowa | 0.1 /100 | #284 | Tragic 73.2% |
| Nicaraguans | 0.1 /100 | #285 | Tragic 73.2% |
| Immigrants | Lebanon | 0.1 /100 | #286 | Tragic 73.1% |
| Immigrants | Korea | 0.1 /100 | #287 | Tragic 73.1% |
| Argentineans | 0.1 /100 | #288 | Tragic 73.1% |
| U.S. Virgin Islanders | 0.1 /100 | #289 | Tragic 73.0% |
| Immigrants | Belarus | 0.1 /100 | #290 | Tragic 73.0% |