Nepalese vs Immigrants from France In Labor Force | Age 20-24
COMPARE
Nepalese
Immigrants from France
In Labor Force | Age 20-24
In Labor Force | Age 20-24 Comparison
Nepalese
Immigrants from France
74.5%
IN LABOR FORCE | AGE 20-24
10.5/ 100
METRIC RATING
219th/ 347
METRIC RANK
74.1%
IN LABOR FORCE | AGE 20-24
3.3/ 100
METRIC RATING
236th/ 347
METRIC RANK
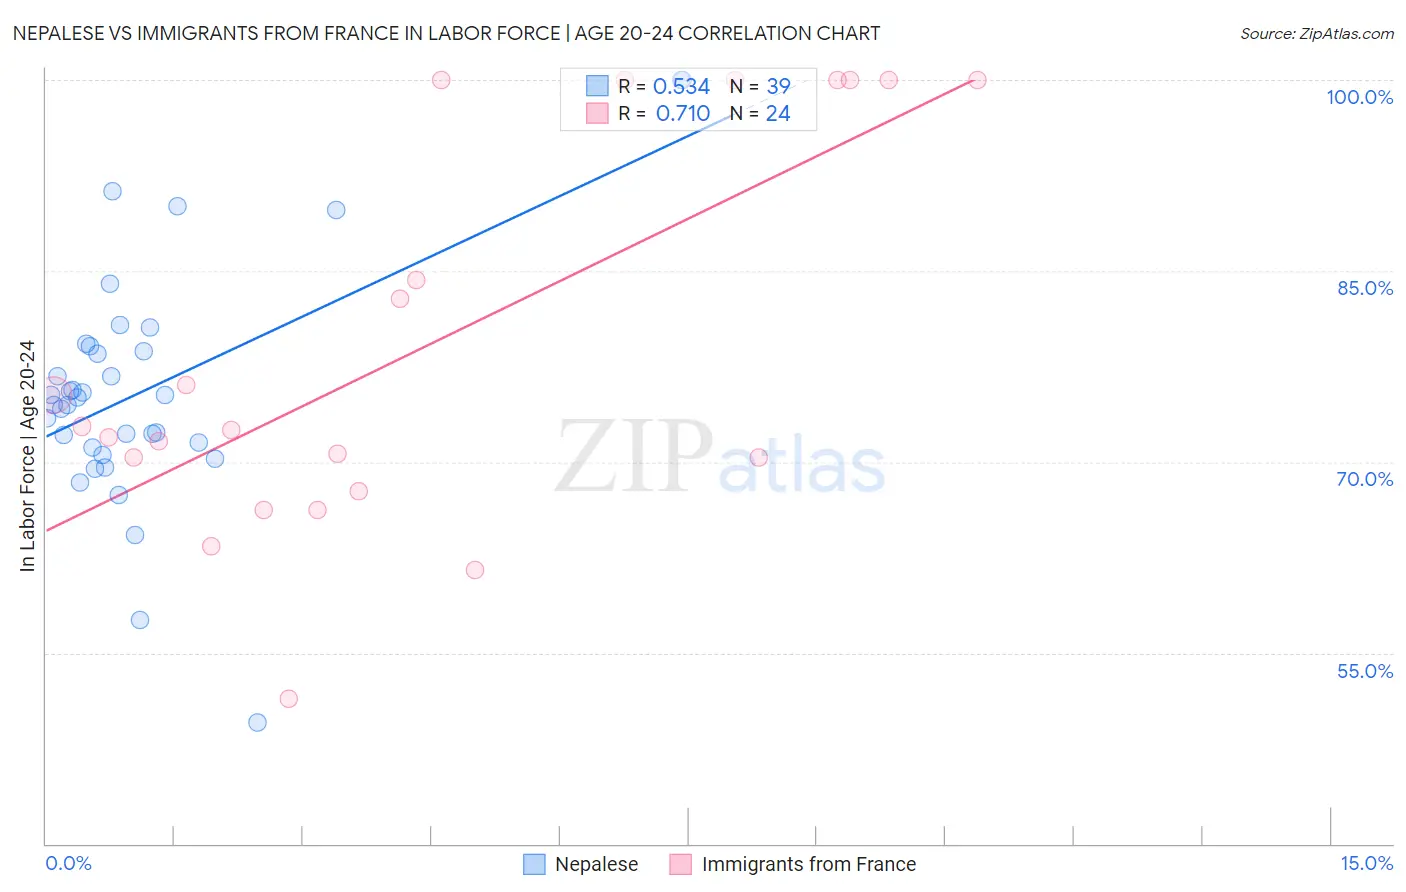
Nepalese vs Immigrants from France In Labor Force | Age 20-24 Correlation Chart
The statistical analysis conducted on geographies consisting of 24,516,862 people shows a substantial positive correlation between the proportion of Nepalese and labor force participation rate among population between the ages 20 and 24 in the United States with a correlation coefficient (R) of 0.534 and weighted average of 74.5%. Similarly, the statistical analysis conducted on geographies consisting of 287,788,278 people shows a strong positive correlation between the proportion of Immigrants from France and labor force participation rate among population between the ages 20 and 24 in the United States with a correlation coefficient (R) of 0.710 and weighted average of 74.1%, a difference of 0.46%.
In Labor Force | Age 20-24 Correlation Summary
| Measurement | Nepalese | Immigrants from France |
| Minimum | 49.5% | 51.4% |
| Maximum | 100.0% | 100.0% |
| Range | 50.5% | 48.6% |
| Mean | 75.7% | 79.0% |
| Median | 75.1% | 72.6% |
| Interquartile 25% (IQ1) | 71.2% | 69.0% |
| Interquartile 75% (IQ3) | 79.0% | 100.0% |
| Interquartile Range (IQR) | 7.9% | 31.0% |
| Standard Deviation (Sample) | 9.6% | 15.2% |
| Standard Deviation (Population) | 9.5% | 14.9% |
Demographics Similar to Nepalese and Immigrants from France by In Labor Force | Age 20-24
In terms of in labor force | age 20-24, the demographic groups most similar to Nepalese are Immigrants from Peru (74.5%, a difference of 0.0%), Immigrants from Norway (74.5%, a difference of 0.010%), Chickasaw (74.5%, a difference of 0.010%), Immigrants from India (74.4%, a difference of 0.030%), and Chilean (74.5%, a difference of 0.070%). Similarly, the demographic groups most similar to Immigrants from France are Bermudan (74.1%, a difference of 0.010%), Laotian (74.1%, a difference of 0.020%), Immigrants (74.1%, a difference of 0.030%), Immigrants from Chile (74.1%, a difference of 0.040%), and Immigrants from Greece (74.2%, a difference of 0.080%).
| Demographics | Rating | Rank | In Labor Force | Age 20-24 |
| Chileans | 12.5 /100 | #217 | Poor 74.5% |
| Immigrants | Peru | 10.6 /100 | #218 | Poor 74.5% |
| Nepalese | 10.5 /100 | #219 | Poor 74.5% |
| Immigrants | Norway | 10.3 /100 | #220 | Poor 74.5% |
| Chickasaw | 10.3 /100 | #221 | Poor 74.5% |
| Immigrants | India | 9.9 /100 | #222 | Tragic 74.4% |
| Hispanics or Latinos | 7.9 /100 | #223 | Tragic 74.4% |
| Seminole | 6.9 /100 | #224 | Tragic 74.3% |
| Ghanaians | 6.2 /100 | #225 | Tragic 74.3% |
| Immigrants | Fiji | 5.9 /100 | #226 | Tragic 74.3% |
| Immigrants | Ireland | 5.8 /100 | #227 | Tragic 74.3% |
| Immigrants | Ukraine | 5.1 /100 | #228 | Tragic 74.2% |
| Immigrants | Sweden | 4.6 /100 | #229 | Tragic 74.2% |
| Immigrants | Albania | 4.3 /100 | #230 | Tragic 74.2% |
| Immigrants | Greece | 4.1 /100 | #231 | Tragic 74.2% |
| Immigrants | Switzerland | 4.1 /100 | #232 | Tragic 74.2% |
| Immigrants | Chile | 3.7 /100 | #233 | Tragic 74.1% |
| Immigrants | Immigrants | 3.6 /100 | #234 | Tragic 74.1% |
| Laotians | 3.5 /100 | #235 | Tragic 74.1% |
| Immigrants | France | 3.3 /100 | #236 | Tragic 74.1% |
| Bermudans | 3.2 /100 | #237 | Tragic 74.1% |