Immigrants from Iran vs Syrian In Labor Force | Age 20-24
COMPARE
Immigrants from Iran
Syrian
In Labor Force | Age 20-24
In Labor Force | Age 20-24 Comparison
Immigrants from Iran
Syrians
71.8%
IN LABOR FORCE | AGE 20-24
0.0/ 100
METRIC RATING
315th/ 347
METRIC RANK
75.0%
IN LABOR FORCE | AGE 20-24
49.5/ 100
METRIC RATING
175th/ 347
METRIC RANK
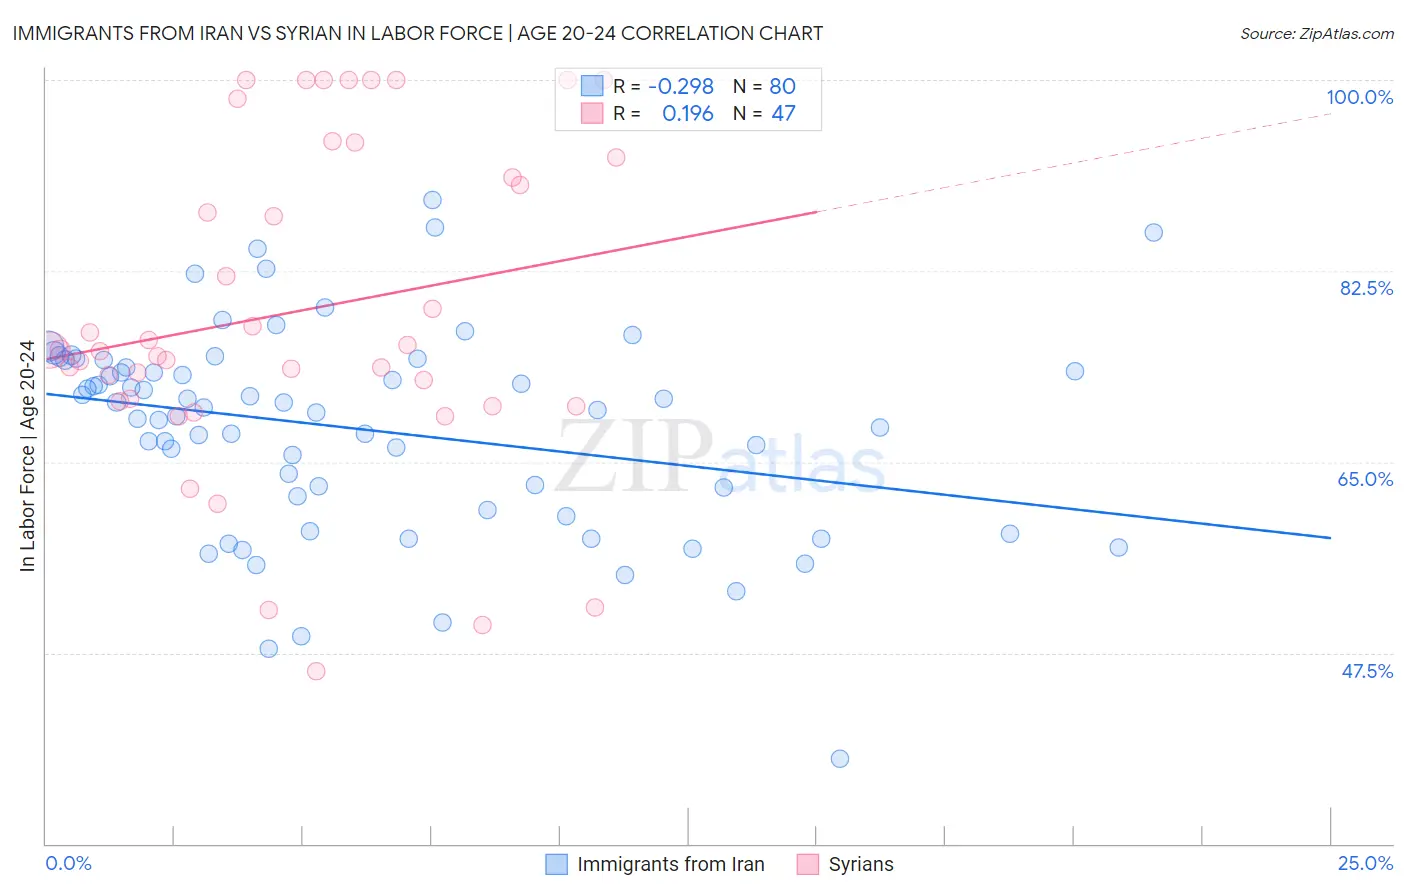
Immigrants from Iran vs Syrian In Labor Force | Age 20-24 Correlation Chart
The statistical analysis conducted on geographies consisting of 279,798,180 people shows a weak negative correlation between the proportion of Immigrants from Iran and labor force participation rate among population between the ages 20 and 24 in the United States with a correlation coefficient (R) of -0.298 and weighted average of 71.8%. Similarly, the statistical analysis conducted on geographies consisting of 266,259,470 people shows a poor positive correlation between the proportion of Syrians and labor force participation rate among population between the ages 20 and 24 in the United States with a correlation coefficient (R) of 0.196 and weighted average of 75.0%, a difference of 4.5%.
In Labor Force | Age 20-24 Correlation Summary
| Measurement | Immigrants from Iran | Syrian |
| Minimum | 37.8% | 45.8% |
| Maximum | 89.0% | 100.0% |
| Range | 51.2% | 54.2% |
| Mean | 68.0% | 78.8% |
| Median | 69.8% | 75.3% |
| Interquartile 25% (IQ1) | 61.2% | 70.6% |
| Interquartile 75% (IQ3) | 74.0% | 92.9% |
| Interquartile Range (IQR) | 12.8% | 22.3% |
| Standard Deviation (Sample) | 9.5% | 14.7% |
| Standard Deviation (Population) | 9.4% | 14.5% |
Similar Demographics by In Labor Force | Age 20-24
Demographics Similar to Immigrants from Iran by In Labor Force | Age 20-24
In terms of in labor force | age 20-24, the demographic groups most similar to Immigrants from Iran are Immigrants from Eastern Asia (71.8%, a difference of 0.040%), Immigrants from Dominica (71.9%, a difference of 0.090%), Indian (Asian) (71.9%, a difference of 0.090%), Immigrants from Caribbean (71.9%, a difference of 0.14%), and Immigrants from Armenia (71.7%, a difference of 0.21%).
| Demographics | Rating | Rank | In Labor Force | Age 20-24 |
| Soviet Union | 0.0 /100 | #308 | Tragic 72.3% |
| Tsimshian | 0.0 /100 | #309 | Tragic 72.3% |
| Immigrants | Cuba | 0.0 /100 | #310 | Tragic 72.0% |
| Apache | 0.0 /100 | #311 | Tragic 72.0% |
| Immigrants | Caribbean | 0.0 /100 | #312 | Tragic 71.9% |
| Immigrants | Dominica | 0.0 /100 | #313 | Tragic 71.9% |
| Indians (Asian) | 0.0 /100 | #314 | Tragic 71.9% |
| Immigrants | Iran | 0.0 /100 | #315 | Tragic 71.8% |
| Immigrants | Eastern Asia | 0.0 /100 | #316 | Tragic 71.8% |
| Immigrants | Armenia | 0.0 /100 | #317 | Tragic 71.7% |
| Immigrants | Hong Kong | 0.0 /100 | #318 | Tragic 71.6% |
| Immigrants | Israel | 0.0 /100 | #319 | Tragic 71.6% |
| Trinidadians and Tobagonians | 0.0 /100 | #320 | Tragic 71.5% |
| Immigrants | Taiwan | 0.0 /100 | #321 | Tragic 71.5% |
| Filipinos | 0.0 /100 | #322 | Tragic 71.4% |
Demographics Similar to Syrians by In Labor Force | Age 20-24
In terms of in labor force | age 20-24, the demographic groups most similar to Syrians are Immigrants from Croatia (75.1%, a difference of 0.010%), South African (75.0%, a difference of 0.010%), Central American (75.0%, a difference of 0.010%), Cajun (75.1%, a difference of 0.020%), and Yakama (75.1%, a difference of 0.020%).
| Demographics | Rating | Rank | In Labor Force | Age 20-24 |
| Immigrants | Western Africa | 56.7 /100 | #168 | Average 75.1% |
| Immigrants | Philippines | 55.8 /100 | #169 | Average 75.1% |
| Mexicans | 52.1 /100 | #170 | Average 75.1% |
| Cajuns | 51.1 /100 | #171 | Average 75.1% |
| Yakama | 50.8 /100 | #172 | Average 75.1% |
| Immigrants | Croatia | 50.2 /100 | #173 | Average 75.1% |
| South Africans | 50.0 /100 | #174 | Average 75.0% |
| Syrians | 49.5 /100 | #175 | Average 75.0% |
| Central Americans | 48.7 /100 | #176 | Average 75.0% |
| Immigrants | Mexico | 47.8 /100 | #177 | Average 75.0% |
| Immigrants | Central America | 45.0 /100 | #178 | Average 75.0% |
| Immigrants | Latvia | 44.1 /100 | #179 | Average 75.0% |
| Immigrants | Czechoslovakia | 44.0 /100 | #180 | Average 75.0% |
| Africans | 42.5 /100 | #181 | Average 75.0% |
| Immigrants | South Africa | 36.9 /100 | #182 | Fair 74.9% |