Immigrants from Haiti vs Immigrants from France In Labor Force | Age 20-24
COMPARE
Immigrants from Haiti
Immigrants from France
In Labor Force | Age 20-24
In Labor Force | Age 20-24 Comparison
Immigrants from Haiti
Immigrants from France
73.6%
IN LABOR FORCE | AGE 20-24
0.5/ 100
METRIC RATING
264th/ 347
METRIC RANK
74.1%
IN LABOR FORCE | AGE 20-24
3.3/ 100
METRIC RATING
236th/ 347
METRIC RANK
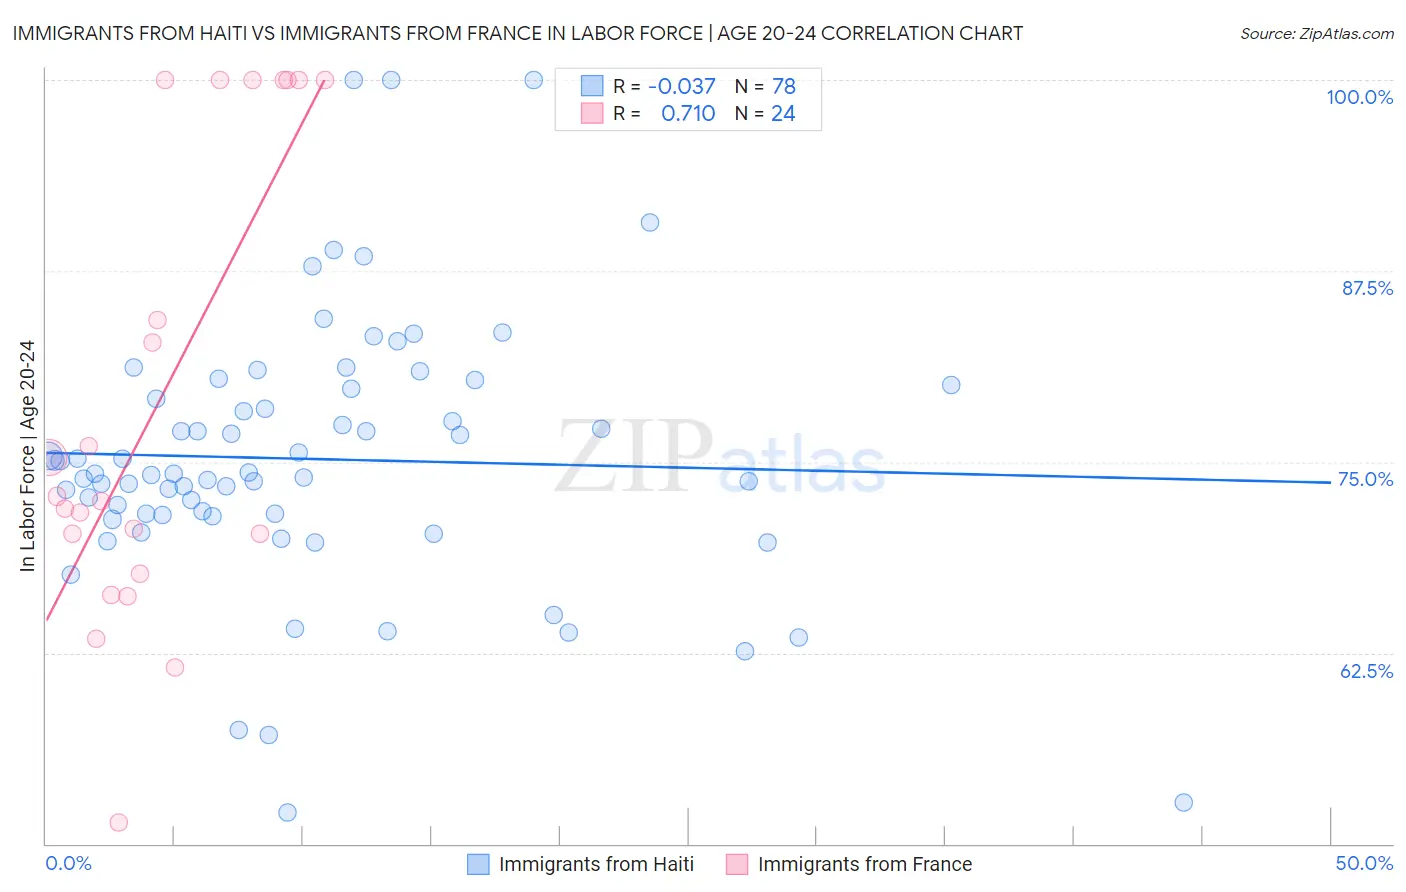
Immigrants from Haiti vs Immigrants from France In Labor Force | Age 20-24 Correlation Chart
The statistical analysis conducted on geographies consisting of 225,234,357 people shows no correlation between the proportion of Immigrants from Haiti and labor force participation rate among population between the ages 20 and 24 in the United States with a correlation coefficient (R) of -0.037 and weighted average of 73.6%. Similarly, the statistical analysis conducted on geographies consisting of 287,788,278 people shows a strong positive correlation between the proportion of Immigrants from France and labor force participation rate among population between the ages 20 and 24 in the United States with a correlation coefficient (R) of 0.710 and weighted average of 74.1%, a difference of 0.73%.
In Labor Force | Age 20-24 Correlation Summary
| Measurement | Immigrants from Haiti | Immigrants from France |
| Minimum | 52.0% | 51.4% |
| Maximum | 100.0% | 100.0% |
| Range | 48.0% | 48.6% |
| Mean | 75.2% | 79.0% |
| Median | 74.2% | 72.6% |
| Interquartile 25% (IQ1) | 71.5% | 69.0% |
| Interquartile 75% (IQ3) | 79.8% | 100.0% |
| Interquartile Range (IQR) | 8.3% | 31.0% |
| Standard Deviation (Sample) | 8.9% | 15.2% |
| Standard Deviation (Population) | 8.8% | 14.9% |
Similar Demographics by In Labor Force | Age 20-24
Demographics Similar to Immigrants from Haiti by In Labor Force | Age 20-24
In terms of in labor force | age 20-24, the demographic groups most similar to Immigrants from Haiti are Immigrants from Asia (73.6%, a difference of 0.010%), Burmese (73.6%, a difference of 0.010%), Haitian (73.6%, a difference of 0.020%), Immigrants from Western Asia (73.5%, a difference of 0.050%), and Asian (73.7%, a difference of 0.090%).
| Demographics | Rating | Rank | In Labor Force | Age 20-24 |
| Paraguayans | 0.8 /100 | #257 | Tragic 73.7% |
| Egyptians | 0.7 /100 | #258 | Tragic 73.7% |
| Dutch West Indians | 0.7 /100 | #259 | Tragic 73.7% |
| Immigrants | Turkey | 0.7 /100 | #260 | Tragic 73.7% |
| Houma | 0.6 /100 | #261 | Tragic 73.7% |
| Asians | 0.6 /100 | #262 | Tragic 73.7% |
| Immigrants | Asia | 0.5 /100 | #263 | Tragic 73.6% |
| Immigrants | Haiti | 0.5 /100 | #264 | Tragic 73.6% |
| Burmese | 0.5 /100 | #265 | Tragic 73.6% |
| Haitians | 0.5 /100 | #266 | Tragic 73.6% |
| Immigrants | Western Asia | 0.4 /100 | #267 | Tragic 73.5% |
| South Americans | 0.4 /100 | #268 | Tragic 73.5% |
| Colombians | 0.3 /100 | #269 | Tragic 73.5% |
| Immigrants | Russia | 0.3 /100 | #270 | Tragic 73.5% |
| Immigrants | Indonesia | 0.3 /100 | #271 | Tragic 73.4% |
Demographics Similar to Immigrants from France by In Labor Force | Age 20-24
In terms of in labor force | age 20-24, the demographic groups most similar to Immigrants from France are Bermudan (74.1%, a difference of 0.010%), Laotian (74.1%, a difference of 0.020%), Immigrants (74.1%, a difference of 0.030%), Immigrants from Chile (74.1%, a difference of 0.040%), and Immigrants from Japan (74.1%, a difference of 0.040%).
| Demographics | Rating | Rank | In Labor Force | Age 20-24 |
| Immigrants | Sweden | 4.6 /100 | #229 | Tragic 74.2% |
| Immigrants | Albania | 4.3 /100 | #230 | Tragic 74.2% |
| Immigrants | Greece | 4.1 /100 | #231 | Tragic 74.2% |
| Immigrants | Switzerland | 4.1 /100 | #232 | Tragic 74.2% |
| Immigrants | Chile | 3.7 /100 | #233 | Tragic 74.1% |
| Immigrants | Immigrants | 3.6 /100 | #234 | Tragic 74.1% |
| Laotians | 3.5 /100 | #235 | Tragic 74.1% |
| Immigrants | France | 3.3 /100 | #236 | Tragic 74.1% |
| Bermudans | 3.2 /100 | #237 | Tragic 74.1% |
| Immigrants | Japan | 3.0 /100 | #238 | Tragic 74.1% |
| Immigrants | Latin America | 2.7 /100 | #239 | Tragic 74.1% |
| Immigrants | Sri Lanka | 2.3 /100 | #240 | Tragic 74.0% |
| Immigrants | Senegal | 2.1 /100 | #241 | Tragic 74.0% |
| Thais | 2.1 /100 | #242 | Tragic 74.0% |
| Immigrants | Syria | 1.9 /100 | #243 | Tragic 74.0% |