Immigrants from Trinidad and Tobago vs Immigrants from France In Labor Force | Age 20-24
COMPARE
Immigrants from Trinidad and Tobago
Immigrants from France
In Labor Force | Age 20-24
In Labor Force | Age 20-24 Comparison
Immigrants from Trinidad and Tobago
Immigrants from France
71.1%
IN LABOR FORCE | AGE 20-24
0.0/ 100
METRIC RATING
327th/ 347
METRIC RANK
74.1%
IN LABOR FORCE | AGE 20-24
3.3/ 100
METRIC RATING
236th/ 347
METRIC RANK
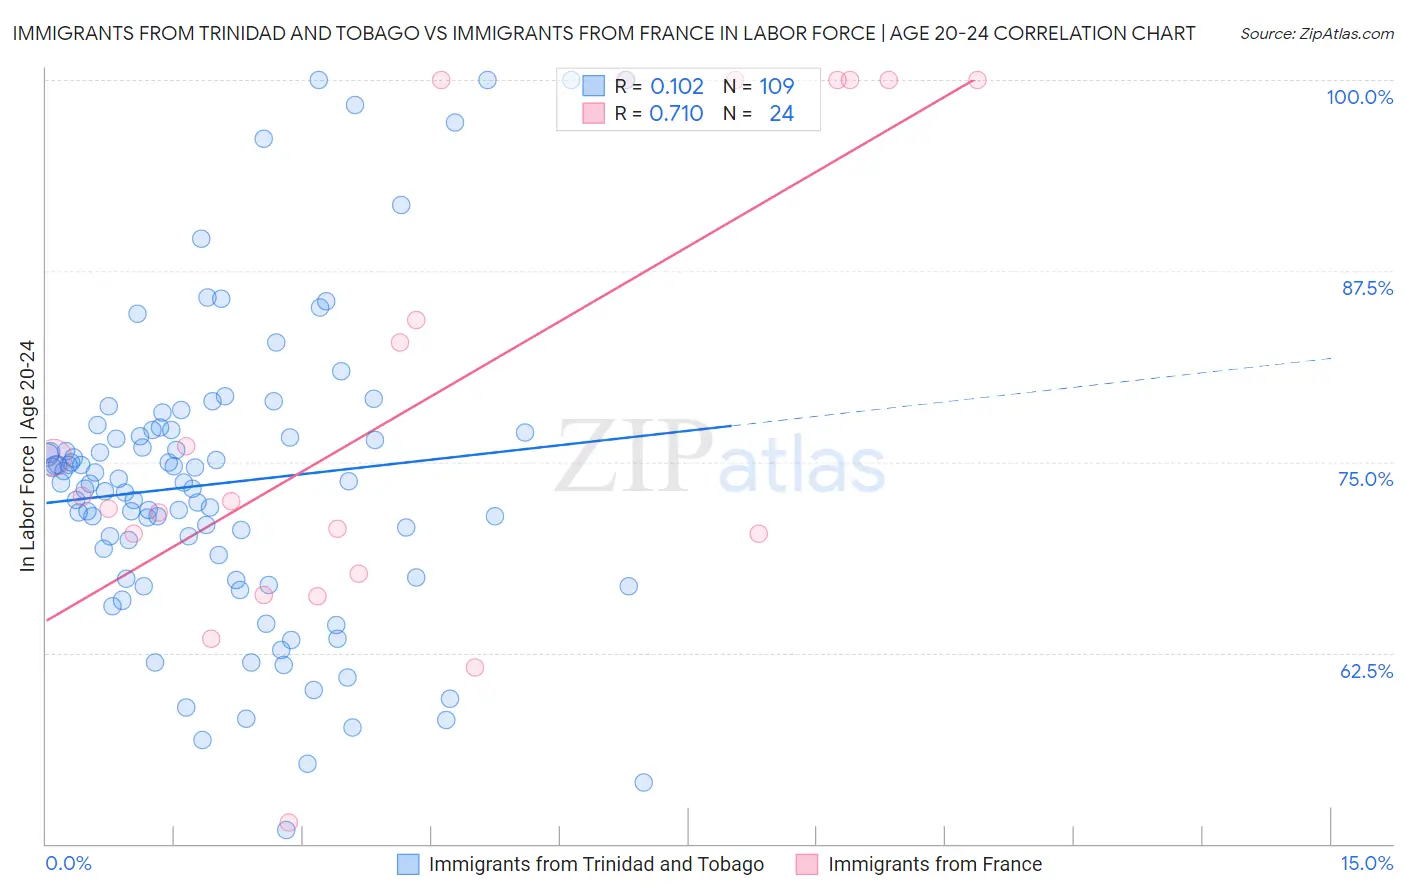
Immigrants from Trinidad and Tobago vs Immigrants from France In Labor Force | Age 20-24 Correlation Chart
The statistical analysis conducted on geographies consisting of 223,471,957 people shows a poor positive correlation between the proportion of Immigrants from Trinidad and Tobago and labor force participation rate among population between the ages 20 and 24 in the United States with a correlation coefficient (R) of 0.102 and weighted average of 71.1%. Similarly, the statistical analysis conducted on geographies consisting of 287,788,278 people shows a strong positive correlation between the proportion of Immigrants from France and labor force participation rate among population between the ages 20 and 24 in the United States with a correlation coefficient (R) of 0.710 and weighted average of 74.1%, a difference of 4.3%.
In Labor Force | Age 20-24 Correlation Summary
| Measurement | Immigrants from Trinidad and Tobago | Immigrants from France |
| Minimum | 50.9% | 51.4% |
| Maximum | 100.0% | 100.0% |
| Range | 49.1% | 48.6% |
| Mean | 73.6% | 79.0% |
| Median | 73.6% | 72.6% |
| Interquartile 25% (IQ1) | 67.4% | 69.0% |
| Interquartile 75% (IQ3) | 77.0% | 100.0% |
| Interquartile Range (IQR) | 9.6% | 31.0% |
| Standard Deviation (Sample) | 10.0% | 15.2% |
| Standard Deviation (Population) | 9.9% | 14.9% |
Similar Demographics by In Labor Force | Age 20-24
Demographics Similar to Immigrants from Trinidad and Tobago by In Labor Force | Age 20-24
In terms of in labor force | age 20-24, the demographic groups most similar to Immigrants from Trinidad and Tobago are Dominican (71.1%, a difference of 0.0%), Immigrants from China (71.1%, a difference of 0.020%), Barbadian (71.1%, a difference of 0.090%), Immigrants from Dominican Republic (71.2%, a difference of 0.19%), and Yup'ik (70.9%, a difference of 0.26%).
| Demographics | Rating | Rank | In Labor Force | Age 20-24 |
| Trinidadians and Tobagonians | 0.0 /100 | #320 | Tragic 71.5% |
| Immigrants | Taiwan | 0.0 /100 | #321 | Tragic 71.5% |
| Filipinos | 0.0 /100 | #322 | Tragic 71.4% |
| West Indians | 0.0 /100 | #323 | Tragic 71.3% |
| Immigrants | Dominican Republic | 0.0 /100 | #324 | Tragic 71.2% |
| Barbadians | 0.0 /100 | #325 | Tragic 71.1% |
| Dominicans | 0.0 /100 | #326 | Tragic 71.1% |
| Immigrants | Trinidad and Tobago | 0.0 /100 | #327 | Tragic 71.1% |
| Immigrants | China | 0.0 /100 | #328 | Tragic 71.1% |
| Yup'ik | 0.0 /100 | #329 | Tragic 70.9% |
| Vietnamese | 0.0 /100 | #330 | Tragic 70.6% |
| Immigrants | Bangladesh | 0.0 /100 | #331 | Tragic 70.6% |
| Immigrants | Uzbekistan | 0.0 /100 | #332 | Tragic 70.4% |
| Yuman | 0.0 /100 | #333 | Tragic 70.3% |
| British West Indians | 0.0 /100 | #334 | Tragic 70.0% |
Demographics Similar to Immigrants from France by In Labor Force | Age 20-24
In terms of in labor force | age 20-24, the demographic groups most similar to Immigrants from France are Bermudan (74.1%, a difference of 0.010%), Laotian (74.1%, a difference of 0.020%), Immigrants (74.1%, a difference of 0.030%), Immigrants from Chile (74.1%, a difference of 0.040%), and Immigrants from Japan (74.1%, a difference of 0.040%).
| Demographics | Rating | Rank | In Labor Force | Age 20-24 |
| Immigrants | Sweden | 4.6 /100 | #229 | Tragic 74.2% |
| Immigrants | Albania | 4.3 /100 | #230 | Tragic 74.2% |
| Immigrants | Greece | 4.1 /100 | #231 | Tragic 74.2% |
| Immigrants | Switzerland | 4.1 /100 | #232 | Tragic 74.2% |
| Immigrants | Chile | 3.7 /100 | #233 | Tragic 74.1% |
| Immigrants | Immigrants | 3.6 /100 | #234 | Tragic 74.1% |
| Laotians | 3.5 /100 | #235 | Tragic 74.1% |
| Immigrants | France | 3.3 /100 | #236 | Tragic 74.1% |
| Bermudans | 3.2 /100 | #237 | Tragic 74.1% |
| Immigrants | Japan | 3.0 /100 | #238 | Tragic 74.1% |
| Immigrants | Latin America | 2.7 /100 | #239 | Tragic 74.1% |
| Immigrants | Sri Lanka | 2.3 /100 | #240 | Tragic 74.0% |
| Immigrants | Senegal | 2.1 /100 | #241 | Tragic 74.0% |
| Thais | 2.1 /100 | #242 | Tragic 74.0% |
| Immigrants | Syria | 1.9 /100 | #243 | Tragic 74.0% |