Immigrants from Iran vs Immigrants from France Births to Unmarried Women
COMPARE
Immigrants from Iran
Immigrants from France
Births to Unmarried Women
Births to Unmarried Women Comparison
Immigrants from Iran
Immigrants from France
24.0%
BIRTHS TO UNMARRIED WOMEN
100.0/ 100
METRIC RATING
6th/ 347
METRIC RANK
29.0%
BIRTHS TO UNMARRIED WOMEN
97.3/ 100
METRIC RATING
88th/ 347
METRIC RANK
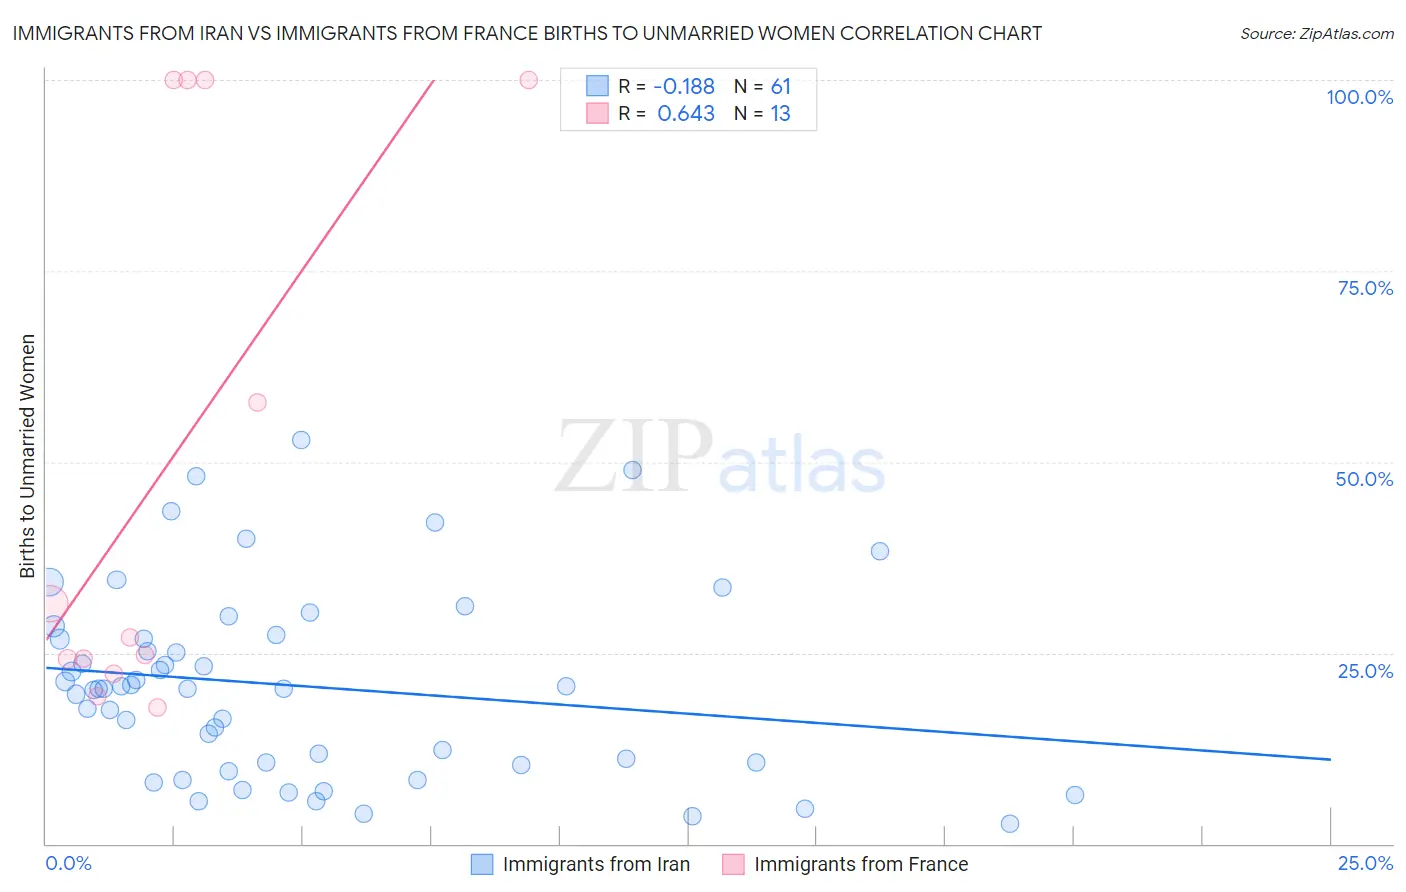
Immigrants from Iran vs Immigrants from France Births to Unmarried Women Correlation Chart
The statistical analysis conducted on geographies consisting of 263,743,481 people shows a poor negative correlation between the proportion of Immigrants from Iran and percentage of births to unmarried women in the United States with a correlation coefficient (R) of -0.188 and weighted average of 24.0%. Similarly, the statistical analysis conducted on geographies consisting of 270,306,848 people shows a significant positive correlation between the proportion of Immigrants from France and percentage of births to unmarried women in the United States with a correlation coefficient (R) of 0.643 and weighted average of 29.0%, a difference of 21.0%.
Births to Unmarried Women Correlation Summary
| Measurement | Immigrants from Iran | Immigrants from France |
| Minimum | 2.7% | 17.9% |
| Maximum | 52.8% | 100.0% |
| Range | 50.1% | 82.1% |
| Mean | 20.6% | 49.9% |
| Median | 20.3% | 26.9% |
| Interquartile 25% (IQ1) | 10.4% | 23.2% |
| Interquartile 75% (IQ3) | 27.1% | 100.0% |
| Interquartile Range (IQR) | 16.6% | 76.8% |
| Standard Deviation (Sample) | 12.2% | 36.1% |
| Standard Deviation (Population) | 12.1% | 34.7% |
Similar Demographics by Births to Unmarried Women
Demographics Similar to Immigrants from Iran by Births to Unmarried Women
In terms of births to unmarried women, the demographic groups most similar to Immigrants from Iran are Thai (24.0%, a difference of 0.29%), Immigrants from Hong Kong (23.6%, a difference of 1.6%), Immigrants from China (24.7%, a difference of 3.0%), Immigrants from South Central Asia (24.7%, a difference of 3.0%), and Immigrants from Taiwan (23.0%, a difference of 4.1%).
| Demographics | Rating | Rank | Births to Unmarried Women |
| Assyrians/Chaldeans/Syriacs | 100.0 /100 | #1 | Exceptional 22.0% |
| Immigrants | India | 100.0 /100 | #2 | Exceptional 22.9% |
| Filipinos | 100.0 /100 | #3 | Exceptional 23.0% |
| Immigrants | Taiwan | 100.0 /100 | #4 | Exceptional 23.0% |
| Immigrants | Hong Kong | 100.0 /100 | #5 | Exceptional 23.6% |
| Immigrants | Iran | 100.0 /100 | #6 | Exceptional 24.0% |
| Thais | 100.0 /100 | #7 | Exceptional 24.0% |
| Immigrants | China | 100.0 /100 | #8 | Exceptional 24.7% |
| Immigrants | South Central Asia | 100.0 /100 | #9 | Exceptional 24.7% |
| Immigrants | Eastern Asia | 100.0 /100 | #10 | Exceptional 25.0% |
| Immigrants | Israel | 100.0 /100 | #11 | Exceptional 25.1% |
| Indians (Asian) | 100.0 /100 | #12 | Exceptional 25.3% |
| Iranians | 100.0 /100 | #13 | Exceptional 25.3% |
| Immigrants | Lebanon | 100.0 /100 | #14 | Exceptional 25.3% |
| Immigrants | Singapore | 100.0 /100 | #15 | Exceptional 25.6% |
Demographics Similar to Immigrants from France by Births to Unmarried Women
In terms of births to unmarried women, the demographic groups most similar to Immigrants from France are Taiwanese (29.0%, a difference of 0.010%), Immigrants from Jordan (29.0%, a difference of 0.080%), Sri Lankan (28.9%, a difference of 0.16%), Immigrants from Saudi Arabia (29.1%, a difference of 0.28%), and Immigrants from Poland (28.9%, a difference of 0.32%).
| Demographics | Rating | Rank | Births to Unmarried Women |
| Immigrants | Austria | 98.1 /100 | #81 | Exceptional 28.7% |
| Romanians | 98.0 /100 | #82 | Exceptional 28.7% |
| Immigrants | Kuwait | 98.0 /100 | #83 | Exceptional 28.8% |
| Immigrants | Poland | 97.6 /100 | #84 | Exceptional 28.9% |
| Sri Lankans | 97.5 /100 | #85 | Exceptional 28.9% |
| Immigrants | Jordan | 97.4 /100 | #86 | Exceptional 29.0% |
| Taiwanese | 97.3 /100 | #87 | Exceptional 29.0% |
| Immigrants | France | 97.3 /100 | #88 | Exceptional 29.0% |
| Immigrants | Saudi Arabia | 97.0 /100 | #89 | Exceptional 29.1% |
| Immigrants | Latvia | 96.8 /100 | #90 | Exceptional 29.1% |
| Immigrants | Fiji | 96.6 /100 | #91 | Exceptional 29.2% |
| Arabs | 96.5 /100 | #92 | Exceptional 29.2% |
| Estonians | 96.5 /100 | #93 | Exceptional 29.2% |
| Ukrainians | 96.3 /100 | #94 | Exceptional 29.2% |
| Immigrants | Vietnam | 96.1 /100 | #95 | Exceptional 29.3% |